29
/
en
AIzaSyAYiBZKx7MnpbEhh9jyipgxe19OcubqV5w
April 1, 2024
247614
Spain
ESP
true
2
1
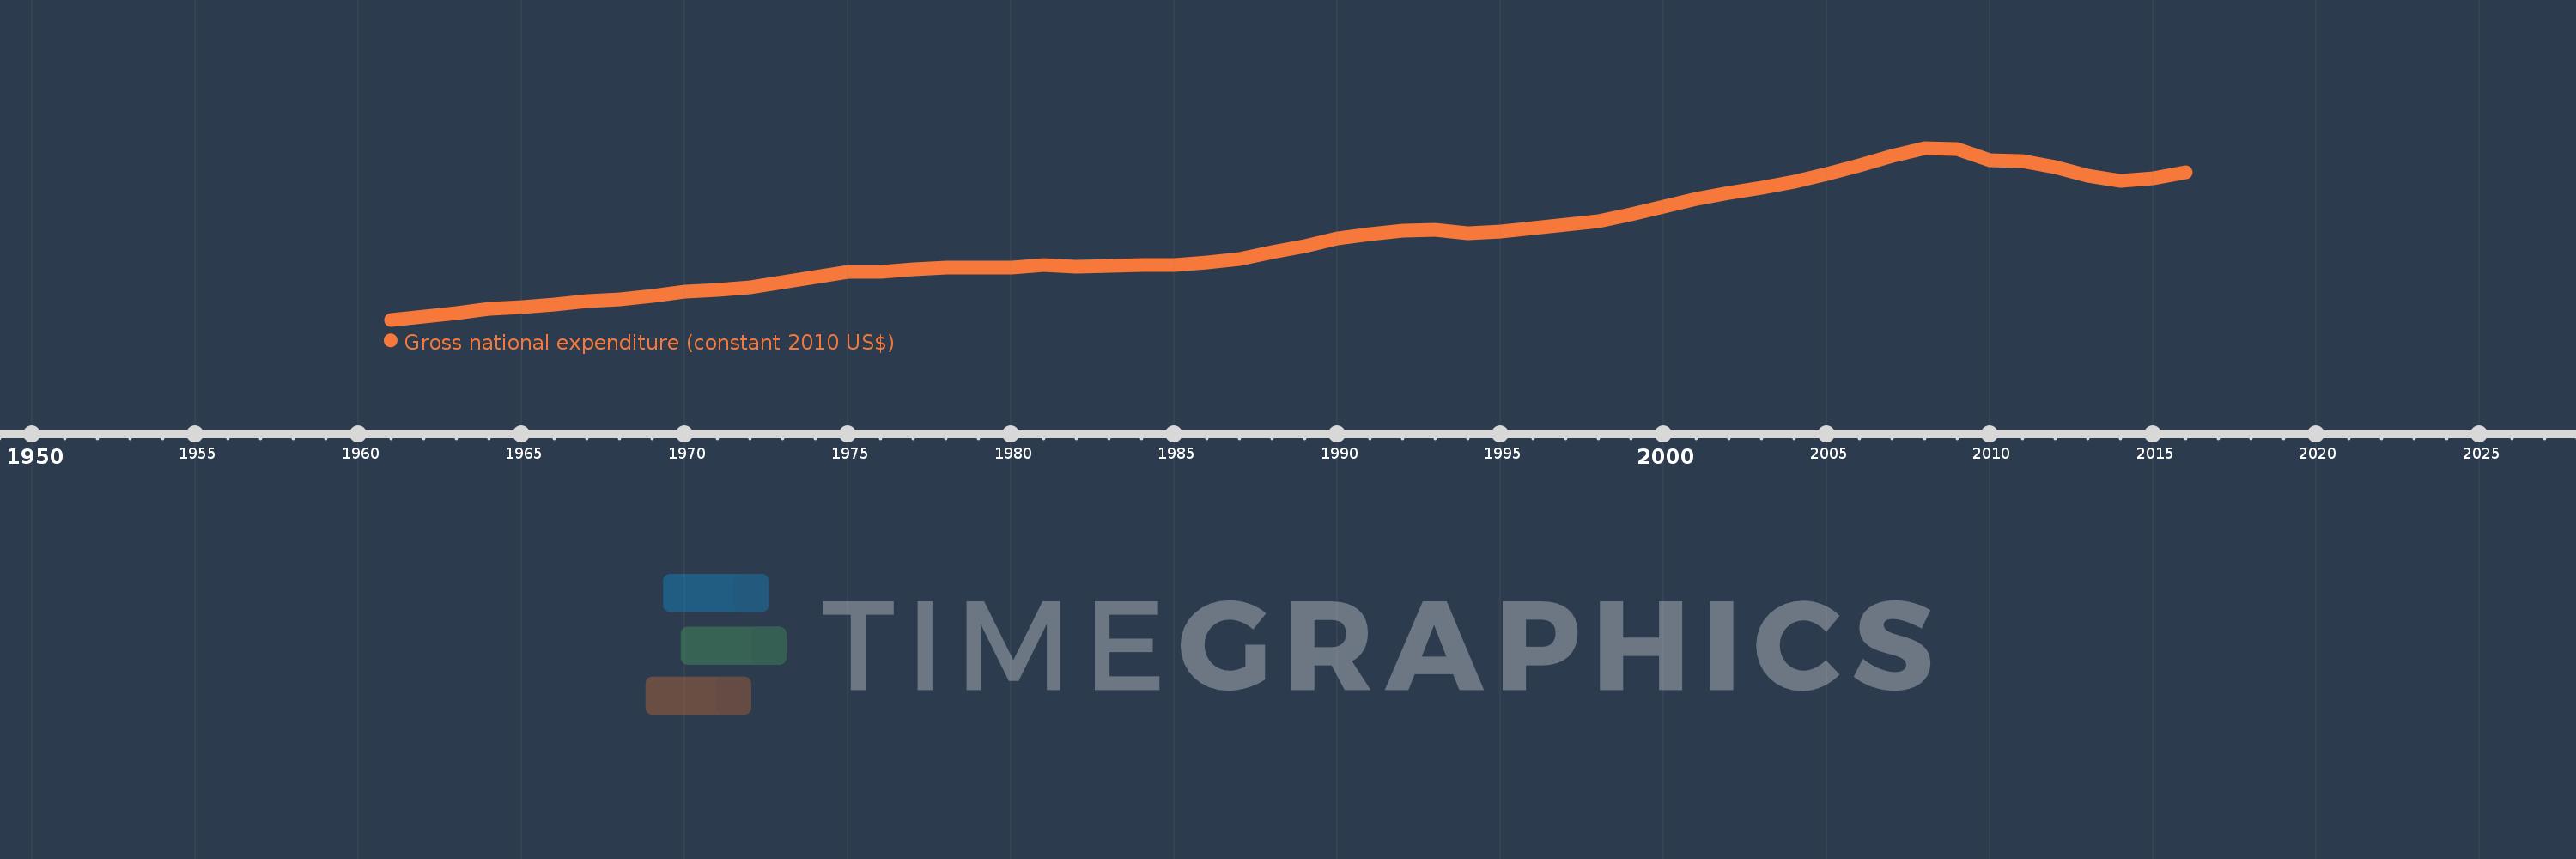
Gross national expenditure (constant 2010 US$)
2016,2015,2014,2013,2012,2011,2010,2009,2008,2007,2006,2005,2004,2003,2002,2001,2000,1999,1998,1997,1996,1995,1994,1993,1992,1991,1990,1989,1988,1987,1986,1985,1984,1983,1982,1981,1980,1979,1978,1977,1976,1975,1974,1973,1972,1971,1970,1969,1968,1967,1966,1965,1964,1963,1962,1961
This statistics in other country:
AfghanistanAlbaniaAlgeriaAngolaAntigua and BarbudaArab WorldArgentinaArmeniaArubaAustraliaAustriaAzerbaijanBahamas, TheBahrainBangladeshBarbadosBelarusBelgiumBelizeBeninBermudaBhutanBoliviaBosnia and HerzegovinaBotswanaBrazilBrunei DarussalamBulgariaBurkina FasoBurundiCabo VerdeCambodiaCameroonCanadaCaribbean small statesCentral African RepublicCentral Europe and the BalticsChadChileChinaColombiaComorosCongo, Dem. Rep.Congo, Rep.Costa RicaCote d'IvoireCroatiaCubaCyprusCzech RepublicDenmarkDominicaDominican RepublicEarly-demographic dividendEast Asia & PacificEast Asia & Pacific (excluding high income)East Asia & Pacific (IDA & IBRD countries)EcuadorEgypt, Arab Rep.El SalvadorEquatorial GuineaEritreaEstoniaEuro areaEurope & Central AsiaEurope & Central Asia (excluding high income)Europe & Central Asia (IDA & IBRD countries)European UnionFaroe IslandsFijiFinlandFragile and conflict affected situationsFranceGabonGambia, TheGeorgiaGermanyGhanaGreeceGrenadaGuatemalaGuineaGuinea-BissauGuyanaHaitiHeavily indebted poor countries (HIPC)High incomeHondurasHong Kong SAR, ChinaHungaryIBRD onlyIcelandIDA & IBRD totalIDA blendIDA onlyIDA totalIndiaIndonesiaIran, Islamic Rep.IraqIrelandIsraelItalyJamaicaJapanJordanKazakhstanKenyaKiribatiKorea, Rep.KosovoKuwaitKyrgyz RepublicLao PDRLate-demographic dividendLatin America & Caribbean Latin America & Caribbean (excluding high income)Latin America & the Caribbean (IDA & IBRD countries)LatviaLeast developed countries: UN classificationLebanonLiberiaLibyaLithuaniaLow & middle incomeLow incomeLower middle incomeLuxembourgMacao SAR, ChinaMacedonia, FYRMadagascarMalawiMalaysiaMaldivesMaliMaltaMauritaniaMauritiusMexicoMiddle East & North AfricaMiddle East & North Africa (excluding high income)Middle East & North Africa (IDA & IBRD countries)Middle incomeMoldovaMongoliaMontenegroMoroccoMozambiqueMyanmarNamibiaNepalNetherlandsNew ZealandNicaraguaNigerNigeriaNorth AmericaNorwayOECD membersOmanOther small statesPacific island small statesPakistanPalauPanamaParaguayPeruPhilippinesPolandPortugalPost-demographic dividendPre-demographic dividendPuerto RicoQatarRomaniaRussian FederationRwandaSamoaSaudi ArabiaSenegalSerbiaSeychellesSierra LeoneSingaporeSlovak RepublicSloveniaSmall statesSolomon IslandsSouth AfricaSouth AsiaSouth Asia (IDA & IBRD)South SudanSpainSri LankaSt. Kitts and NevisSt. LuciaSt. Vincent and the GrenadinesSub-Saharan Africa Sub-Saharan Africa (excluding high income)Sub-Saharan Africa (IDA & IBRD countries)SudanSurinameSwazilandSwedenSwitzerlandTajikistanTanzaniaThailandTimor-LesteTogoTongaTrinidad and TobagoTunisiaTurkeyTurkmenistanUgandaUkraineUnited Arab EmiratesUnited KingdomUnited StatesUpper middle incomeUruguayUzbekistanVanuatuVenezuela, RBVietnamWest Bank and GazaWorldYemen, Rep.ZambiaZimbabwe Timeline:
This timeline shows a graph from 1961 to 2016 of Spain. No data until 1960. Number of actual observations by date: 56.
Source name:
World Development Indicators
Source organization:
World Bank national accounts data, and OECD National Accounts data files.
Categories, topics:
Economy & Growth
Last updated:
apr 23, 2017
Indicators value changes by year
Minimum:
218.428 bln
jan 1, 1961
Maximum:
1.556 trl
jan 1, 2008
At the date of observation
Value
Absolute change
Change from previous value
jan 1, 1961
218.428 bln
+218.428 bln
0.0%
jan 1, 1962
246.224 bln
+27.796 bln
12.73%
jan 1, 1963
272.225 bln
+26.001 bln
10.56%
jan 1, 1964
300.522 bln
+28.297 bln
10.39%
jan 1, 1965
314.676 bln
+14.154 bln
4.71%
jan 1, 1966
338.002 bln
+23.326 bln
7.41%
jan 1, 1967
363.212 bln
+25.21 bln
7.46%
jan 1, 1968
379.218 bln
+16.006 bln
4.41%
jan 1, 1969
402.132 bln
+22.914 bln
6.04%
jan 1, 1970
437.929 bln
+35.796 bln
8.9%
jan 1, 1971
453.709 bln
+15.78 bln
3.6%
jan 1, 1972
470.483 bln
+16.775 bln
3.7%
jan 1, 1973
511.546 bln
+41.063 bln
8.73%
jan 1, 1974
553.667 bln
+42.121 bln
8.23%
jan 1, 1975
588.92 bln
+35.252 bln
6.37%
jan 1, 1976
591.896 bln
+2.976 bln
0.51%
jan 1, 1977
613.601 bln
+21.706 bln
3.67%
jan 1, 1978
622.33 bln
+8.728 bln
1.42%
jan 1, 1979
625.199 bln
+2.869 bln
0.46%
jan 1, 1980
627.363 bln
+2.164 bln
0.35%
jan 1, 1981
641.691 bln
+14.328 bln
2.28%
jan 1, 1982
631.471 bln
-10.22 bln
-1.59%
jan 1, 1983
638.082 bln
+6.611 bln
1.05%
jan 1, 1984
641.711 bln
+3.63 bln
0.57%
jan 1, 1985
642.816 bln
+1.105 bln
0.17%
jan 1, 1986
662.066 bln
+19.25 bln
2.99%
jan 1, 1987
694.393 bln
+32.327 bln
4.88%
jan 1, 1988
745.981 bln
+51.587 bln
7.43%
jan 1, 1989
794.387 bln
+48.407 bln
6.49%
jan 1, 1990
848.701 bln
+54.314 bln
6.84%
jan 1, 1991
886.45 bln
+37.749 bln
4.45%
jan 1, 1992
912.38 bln
+25.93 bln
2.93%
jan 1, 1993
921.03 bln
+8.649 bln
0.95%
jan 1, 1994
893.923 bln
-27.106 bln
-2.94%
jan 1, 1995
907.9 bln
+13.976 bln
1.56%
jan 1, 1996
934.997 bln
+27.098 bln
2.98%
jan 1, 1997
955.211 bln
+20.213 bln
2.16%
jan 1, 1998
986.138 bln
+30.927 bln
3.24%
jan 1, 1999
1.041 trl
+54.532 bln
5.53%
jan 1, 2000
1.101 trl
+60.518 bln
5.82%
jan 1, 2001
1.157 trl
+56.04 bln
5.09%
jan 1, 2002
1.203 trl
+45.774 bln
3.96%
jan 1, 2003
1.244 trl
+41.307 bln
3.43%
jan 1, 2004
1.292 trl
+47.628 bln
3.83%
jan 1, 2005
1.353 trl
+60.776 bln
4.7%
jan 1, 2006
1.422 trl
+69.001 bln
5.1%
jan 1, 2007
1.494 trl
+72.641 bln
5.11%
jan 1, 2008
1.556 trl
+61.213 bln
4.1%
jan 1, 2009
1.549 trl
-6.587 bln
-0.42%
jan 1, 2010
1.457 trl
-92.223 bln
-5.95%
jan 1, 2011
1.45 trl
-6.403 bln
-0.44%
jan 1, 2012
1.406 trl
-44.466 bln
-3.07%
jan 1, 2013
1.341 trl
-64.963 bln
-4.62%
jan 1, 2014
1.3 trl
-41.319 bln
-3.08%
jan 1, 2015
1.32 trl
+20.246 bln
1.56%
jan 1, 2016
1.369 trl
+49.046 bln
3.72%
Ranking of countries by current statistics by years


Comments: