29
/
en
AIzaSyAYiBZKx7MnpbEhh9jyipgxe19OcubqV5w
April 1, 2024
202991
Mozambique
MOZ
true
2
1
Gross national expenditure (constant 2010 US$)
2016,2015,2014,2013,2012,2011,2010,2009,2008,2007,2006,2005,2004,2003,2002,2001,2000,1999,1998,1997,1996,1995,1994,1993,1992,1991,1990,1989,1988,1987,1986,1985,1984,1983,1982,1981
This statistics in other country:
AfghanistanAlbaniaAlgeriaAngolaAntigua and BarbudaArab WorldArgentinaArmeniaArubaAustraliaAustriaAzerbaijanBahamas, TheBahrainBangladeshBarbadosBelarusBelgiumBelizeBeninBermudaBhutanBoliviaBosnia and HerzegovinaBotswanaBrazilBrunei DarussalamBulgariaBurkina FasoBurundiCabo VerdeCambodiaCameroonCanadaCaribbean small statesCentral African RepublicCentral Europe and the BalticsChadChileChinaColombiaComorosCongo, Dem. Rep.Congo, Rep.Costa RicaCote d'IvoireCroatiaCubaCyprusCzech RepublicDenmarkDominicaDominican RepublicEarly-demographic dividendEast Asia & PacificEast Asia & Pacific (excluding high income)East Asia & Pacific (IDA & IBRD countries)EcuadorEgypt, Arab Rep.El SalvadorEquatorial GuineaEritreaEstoniaEuro areaEurope & Central AsiaEurope & Central Asia (excluding high income)Europe & Central Asia (IDA & IBRD countries)European UnionFaroe IslandsFijiFinlandFragile and conflict affected situationsFranceGabonGambia, TheGeorgiaGermanyGhanaGreeceGrenadaGuatemalaGuineaGuinea-BissauGuyanaHaitiHeavily indebted poor countries (HIPC)High incomeHondurasHong Kong SAR, ChinaHungaryIBRD onlyIcelandIDA & IBRD totalIDA blendIDA onlyIDA totalIndiaIndonesiaIran, Islamic Rep.IraqIrelandIsraelItalyJamaicaJapanJordanKazakhstanKenyaKiribatiKorea, Rep.KosovoKuwaitKyrgyz RepublicLao PDRLate-demographic dividendLatin America & Caribbean Latin America & Caribbean (excluding high income)Latin America & the Caribbean (IDA & IBRD countries)LatviaLeast developed countries: UN classificationLebanonLiberiaLibyaLithuaniaLow & middle incomeLow incomeLower middle incomeLuxembourgMacao SAR, ChinaMacedonia, FYRMadagascarMalawiMalaysiaMaldivesMaliMaltaMauritaniaMauritiusMexicoMiddle East & North AfricaMiddle East & North Africa (excluding high income)Middle East & North Africa (IDA & IBRD countries)Middle incomeMoldovaMongoliaMontenegroMoroccoMozambiqueMyanmarNamibiaNepalNetherlandsNew ZealandNicaraguaNigerNigeriaNorth AmericaNorwayOECD membersOmanOther small statesPacific island small statesPakistanPalauPanamaParaguayPeruPhilippinesPolandPortugalPost-demographic dividendPre-demographic dividendPuerto RicoQatarRomaniaRussian FederationRwandaSamoaSaudi ArabiaSenegalSerbiaSeychellesSierra LeoneSingaporeSlovak RepublicSloveniaSmall statesSolomon IslandsSouth AfricaSouth AsiaSouth Asia (IDA & IBRD)South SudanSpainSri LankaSt. Kitts and NevisSt. LuciaSt. Vincent and the GrenadinesSub-Saharan Africa Sub-Saharan Africa (excluding high income)Sub-Saharan Africa (IDA & IBRD countries)SudanSurinameSwazilandSwedenSwitzerlandTajikistanTanzaniaThailandTimor-LesteTogoTongaTrinidad and TobagoTunisiaTurkeyTurkmenistanUgandaUkraineUnited Arab EmiratesUnited KingdomUnited StatesUpper middle incomeUruguayUzbekistanVanuatuVenezuela, RBVietnamWest Bank and GazaWorldYemen, Rep.ZambiaZimbabwe Timeline:
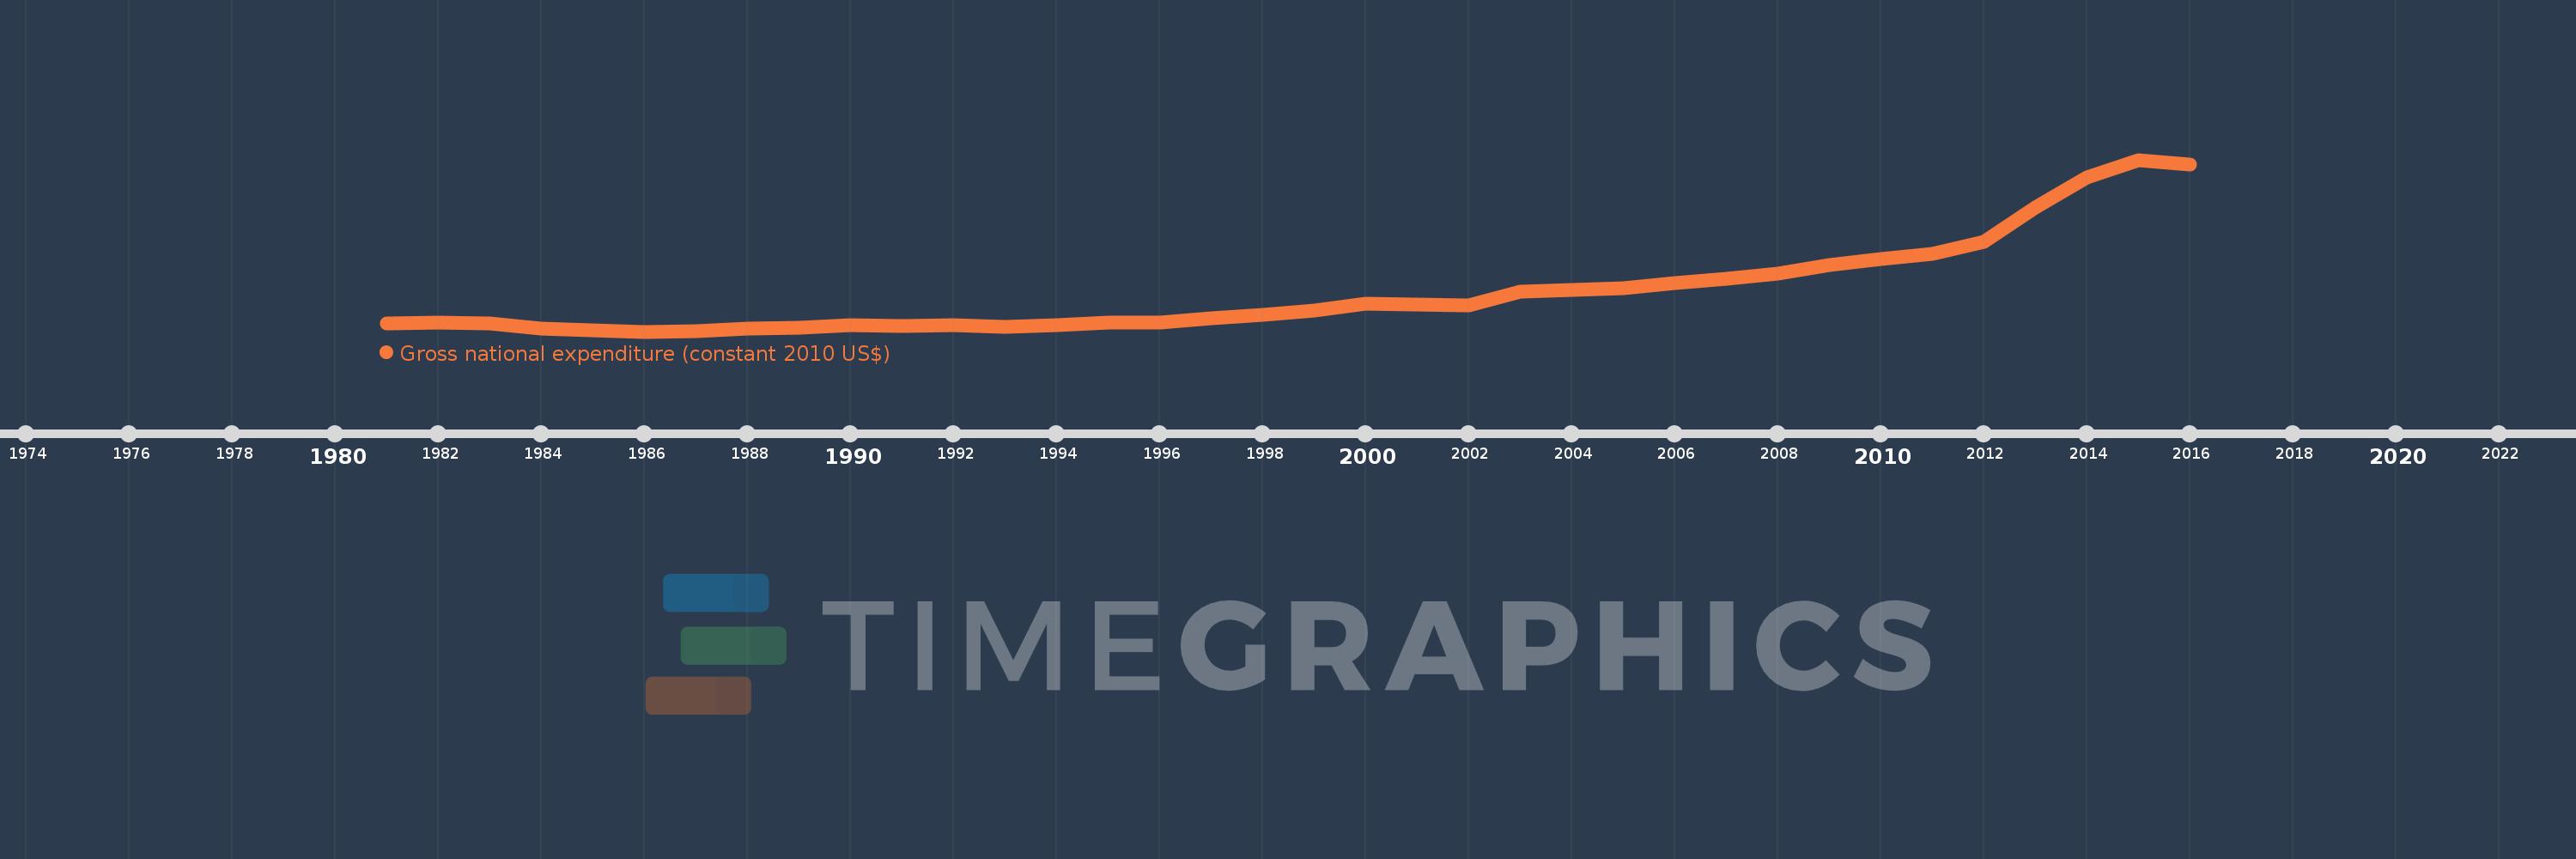
This timeline shows a graph from 1981 to 2016 of Mozambique. No data until 1980. Number of actual observations by date: 36.
Source name:
World Development Indicators
Source organization:
World Bank national accounts data, and OECD National Accounts data files.
Categories, topics:
Economy & Growth
Last updated:
apr 23, 2017
Indicators value changes by year
Minimum:
2.578 bln
jan 1, 1986
Maximum:
22.533 bln
jan 1, 2015
At the date of observation
Value
Absolute change
Change from previous value
jan 1, 1981
3.566 bln
+3.566 bln
0.0%
jan 1, 1982
3.584 bln
+18.597 mln
0.52%
jan 1, 1983
3.504 bln
-79.95 mln
-2.23%
jan 1, 1984
2.943 bln
-561.728 mln
-16.03%
jan 1, 1985
2.765 bln
-177.053 mln
-6.02%
jan 1, 1986
2.578 bln
-187.202 mln
-6.77%
jan 1, 1987
2.643 bln
+64.941 mln
2.52%
jan 1, 1988
2.931 bln
+287.467 mln
10.88%
jan 1, 1989
3.058 bln
+127.382 mln
4.35%
jan 1, 1990
3.289 bln
+230.98 mln
7.55%
jan 1, 1991
3.231 bln
-58.295 mln
-1.77%
jan 1, 1992
3.339 bln
+107.858 mln
3.34%
jan 1, 1993
3.103 bln
-235.639 mln
-7.06%
jan 1, 1994
3.303 bln
+200.434 mln
6.46%
jan 1, 1995
3.639 bln
+335.26 mln
10.15%
jan 1, 1996
3.657 bln
+18.711 mln
0.51%
jan 1, 1997
4.17 bln
+512.25 mln
14.01%
jan 1, 1998
4.509 bln
+339.813 mln
8.15%
jan 1, 1999
5.004 bln
+495.004 mln
10.98%
jan 1, 2000
5.856 bln
+851.121 mln
17.01%
jan 1, 2001
5.736 bln
-119.383 mln
-2.04%
jan 1, 2002
5.651 bln
-85.657 mln
-1.49%
jan 1, 2003
7.168 bln
+1.518 bln
26.86%
jan 1, 2004
7.423 bln
+254.338 mln
3.55%
jan 1, 2005
7.621 bln
+198.268 mln
2.67%
jan 1, 2006
8.235 bln
+614.447 mln
8.06%
jan 1, 2007
8.731 bln
+495.4 mln
6.02%
jan 1, 2008
9.36 bln
+629.181 mln
7.21%
jan 1, 2009
10.3 bln
+940.599 mln
10.05%
jan 1, 2010
10.985 bln
+684.202 mln
6.64%
jan 1, 2011
11.648 bln
+663.391 mln
6.04%
jan 1, 2012
13.024 bln
+1.376 bln
11.81%
jan 1, 2013
16.987 bln
+3.963 bln
30.43%
jan 1, 2014
20.49 bln
+3.503 bln
20.62%
jan 1, 2015
22.533 bln
+2.043 bln
9.97%
jan 1, 2016
21.994 bln
-538.848 mln
-2.39%
Ranking of countries by current statistics by years


Comments: