29
/
en
AIzaSyAYiBZKx7MnpbEhh9jyipgxe19OcubqV5w
April 1, 2024
167564
Kenya
KEN
true
2
1
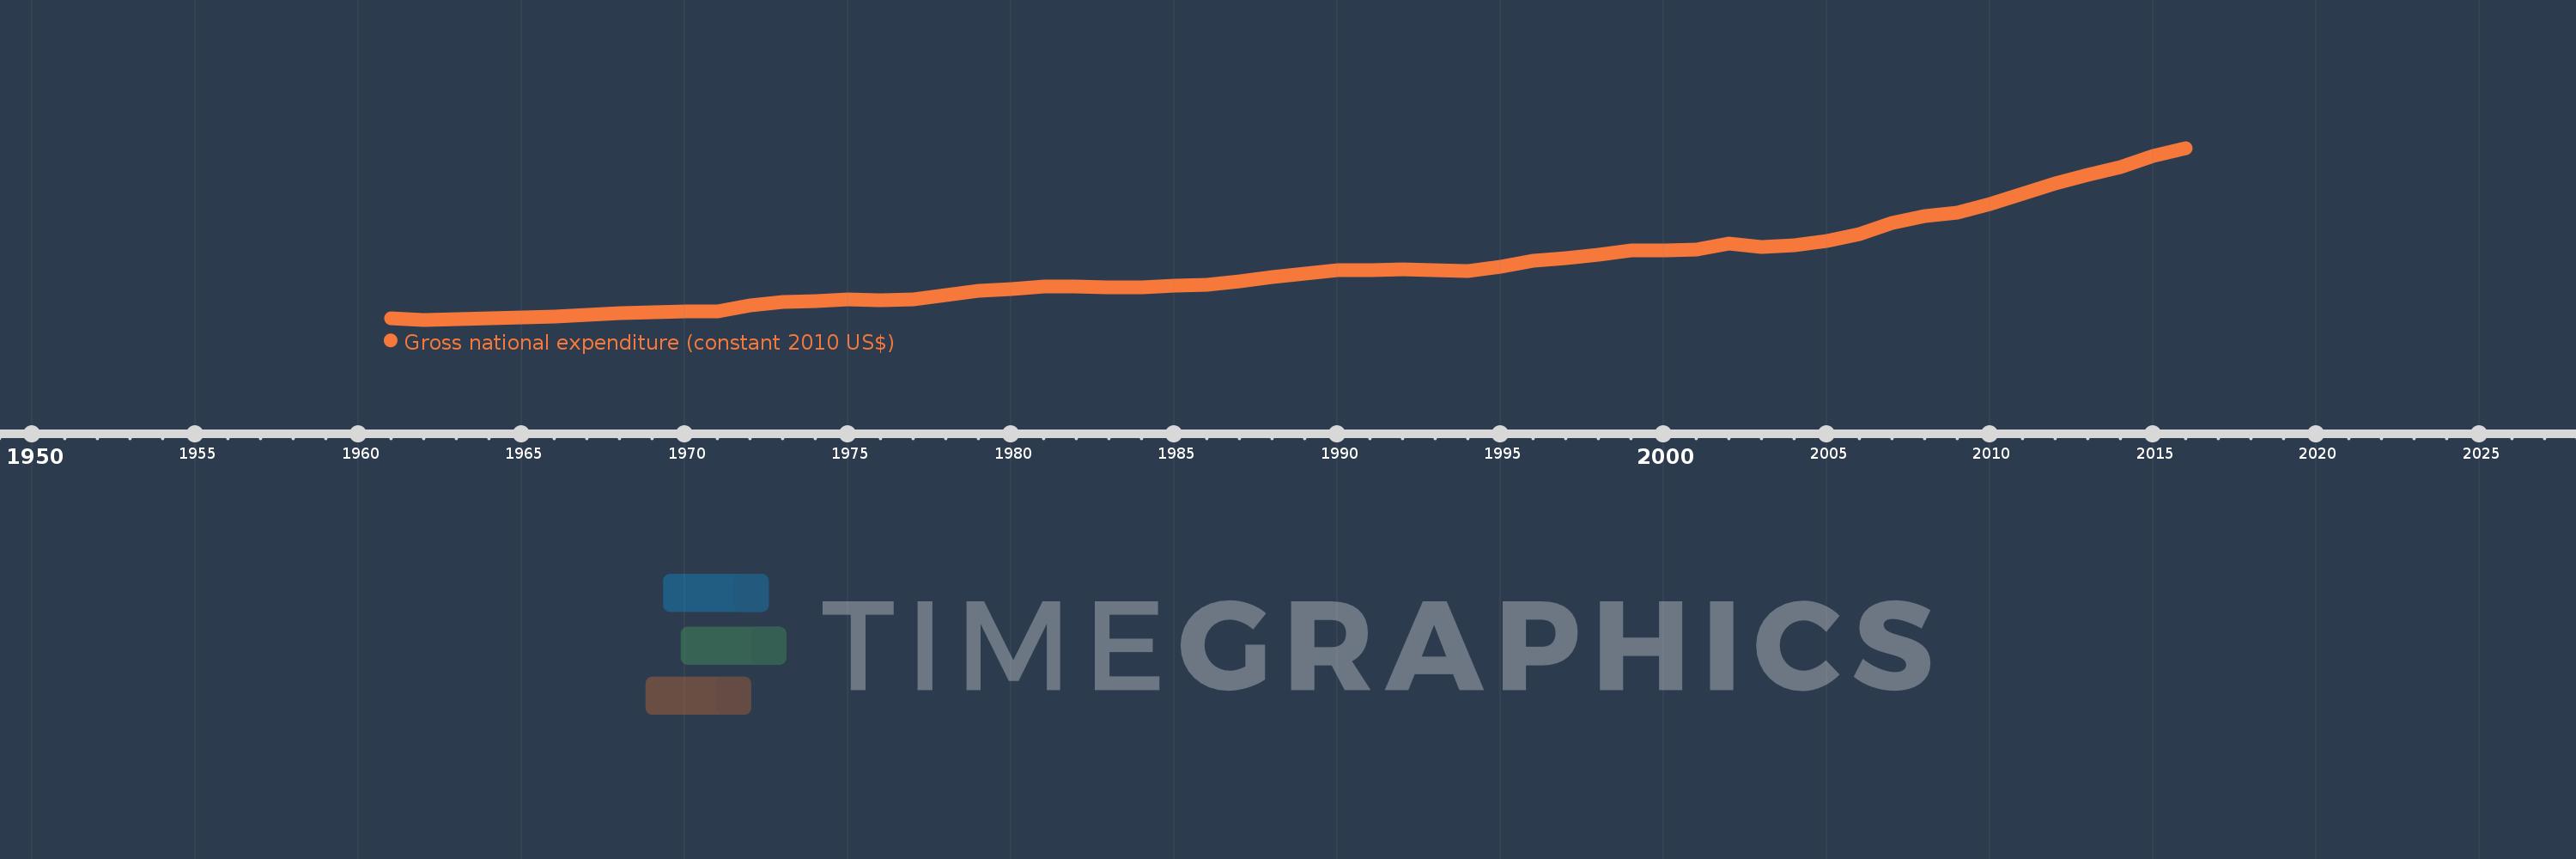
Gross national expenditure (constant 2010 US$)
2016,2015,2014,2013,2012,2011,2010,2009,2008,2007,2006,2005,2004,2003,2002,2001,2000,1999,1998,1997,1996,1995,1994,1993,1992,1991,1990,1989,1988,1987,1986,1985,1984,1983,1982,1981,1980,1979,1978,1977,1976,1975,1974,1973,1972,1971,1970,1969,1968,1967,1966,1965,1964,1963,1962,1961
This statistics in other country:
AfghanistanAlbaniaAlgeriaAngolaAntigua and BarbudaArab WorldArgentinaArmeniaArubaAustraliaAustriaAzerbaijanBahamas, TheBahrainBangladeshBarbadosBelarusBelgiumBelizeBeninBermudaBhutanBoliviaBosnia and HerzegovinaBotswanaBrazilBrunei DarussalamBulgariaBurkina FasoBurundiCabo VerdeCambodiaCameroonCanadaCaribbean small statesCentral African RepublicCentral Europe and the BalticsChadChileChinaColombiaComorosCongo, Dem. Rep.Congo, Rep.Costa RicaCote d'IvoireCroatiaCubaCyprusCzech RepublicDenmarkDominicaDominican RepublicEarly-demographic dividendEast Asia & PacificEast Asia & Pacific (excluding high income)East Asia & Pacific (IDA & IBRD countries)EcuadorEgypt, Arab Rep.El SalvadorEquatorial GuineaEritreaEstoniaEuro areaEurope & Central AsiaEurope & Central Asia (excluding high income)Europe & Central Asia (IDA & IBRD countries)European UnionFaroe IslandsFijiFinlandFragile and conflict affected situationsFranceGabonGambia, TheGeorgiaGermanyGhanaGreeceGrenadaGuatemalaGuineaGuinea-BissauGuyanaHaitiHeavily indebted poor countries (HIPC)High incomeHondurasHong Kong SAR, ChinaHungaryIBRD onlyIcelandIDA & IBRD totalIDA blendIDA onlyIDA totalIndiaIndonesiaIran, Islamic Rep.IraqIrelandIsraelItalyJamaicaJapanJordanKazakhstanKenyaKiribatiKorea, Rep.KosovoKuwaitKyrgyz RepublicLao PDRLate-demographic dividendLatin America & Caribbean Latin America & Caribbean (excluding high income)Latin America & the Caribbean (IDA & IBRD countries)LatviaLeast developed countries: UN classificationLebanonLiberiaLibyaLithuaniaLow & middle incomeLow incomeLower middle incomeLuxembourgMacao SAR, ChinaMacedonia, FYRMadagascarMalawiMalaysiaMaldivesMaliMaltaMauritaniaMauritiusMexicoMiddle East & North AfricaMiddle East & North Africa (excluding high income)Middle East & North Africa (IDA & IBRD countries)Middle incomeMoldovaMongoliaMontenegroMoroccoMozambiqueMyanmarNamibiaNepalNetherlandsNew ZealandNicaraguaNigerNigeriaNorth AmericaNorwayOECD membersOmanOther small statesPacific island small statesPakistanPalauPanamaParaguayPeruPhilippinesPolandPortugalPost-demographic dividendPre-demographic dividendPuerto RicoQatarRomaniaRussian FederationRwandaSamoaSaudi ArabiaSenegalSerbiaSeychellesSierra LeoneSingaporeSlovak RepublicSloveniaSmall statesSolomon IslandsSouth AfricaSouth AsiaSouth Asia (IDA & IBRD)South SudanSpainSri LankaSt. Kitts and NevisSt. LuciaSt. Vincent and the GrenadinesSub-Saharan Africa Sub-Saharan Africa (excluding high income)Sub-Saharan Africa (IDA & IBRD countries)SudanSurinameSwazilandSwedenSwitzerlandTajikistanTanzaniaThailandTimor-LesteTogoTongaTrinidad and TobagoTunisiaTurkeyTurkmenistanUgandaUkraineUnited Arab EmiratesUnited KingdomUnited StatesUpper middle incomeUruguayUzbekistanVanuatuVenezuela, RBVietnamWest Bank and GazaWorldYemen, Rep.ZambiaZimbabwe Timeline:
This timeline shows a graph from 1961 to 2016 of Kenya. No data until 1960. Number of actual observations by date: 56.
Source name:
World Development Indicators
Source organization:
World Bank national accounts data, and OECD National Accounts data files.
Categories, topics:
Economy & Growth
Last updated:
apr 23, 2017
Indicators value changes by year
Minimum:
4.105 bln
jan 1, 1962
Maximum:
60.125 bln
jan 1, 2016
At the date of observation
Value
Absolute change
Change from previous value
jan 1, 1961
4.55 bln
+4.55 bln
0.0%
jan 1, 1962
4.105 bln
-445.311 mln
-9.79%
jan 1, 1963
4.376 bln
+271.525 mln
6.61%
jan 1, 1964
4.672 bln
+295.828 mln
6.76%
jan 1, 1965
4.862 bln
+190.006 mln
4.07%
jan 1, 1966
5.12 bln
+257.985 mln
5.31%
jan 1, 1967
5.823 bln
+702.928 mln
13.73%
jan 1, 1968
6.156 bln
+332.97 mln
5.72%
jan 1, 1969
6.553 bln
+396.865 mln
6.45%
jan 1, 1970
6.932 bln
+378.943 mln
5.78%
jan 1, 1971
6.916 bln
-15.461 mln
-0.22%
jan 1, 1972
8.716 bln
+1.8 bln
26.02%
jan 1, 1973
9.924 bln
+1.208 bln
13.86%
jan 1, 1974
10.265 bln
+341.115 mln
3.44%
jan 1, 1975
10.799 bln
+533.967 mln
5.2%
jan 1, 1976
10.523 bln
-276.238 mln
-2.56%
jan 1, 1977
10.649 bln
+126.492 mln
1.2%
jan 1, 1978
12.013 bln
+1.364 bln
12.81%
jan 1, 1979
13.501 bln
+1.488 bln
12.39%
jan 1, 1980
13.981 bln
+479.96 mln
3.55%
jan 1, 1981
14.882 bln
+901.463 mln
6.45%
jan 1, 1982
14.935 bln
+52.358 mln
0.35%
jan 1, 1983
14.715 bln
-219.999 mln
-1.47%
jan 1, 1984
14.623 bln
-91.895 mln
-0.62%
jan 1, 1985
15.154 bln
+530.96 mln
3.63%
jan 1, 1986
15.533 bln
+379.386 mln
2.5%
jan 1, 1987
16.743 bln
+1.21 bln
7.79%
jan 1, 1988
18.054 bln
+1.311 bln
7.83%
jan 1, 1989
19.286 bln
+1.232 bln
6.82%
jan 1, 1990
20.168 bln
+881.927 mln
4.57%
jan 1, 1991
20.361 bln
+193.196 mln
0.96%
jan 1, 1992
20.601 bln
+239.645 mln
1.18%
jan 1, 1993
20.394 bln
-206.832 mln
-1.0%
jan 1, 1994
20.056 bln
-338.096 mln
-1.66%
jan 1, 1995
21.286 bln
+1.23 bln
6.13%
jan 1, 1996
23.406 bln
+2.12 bln
9.96%
jan 1, 1997
24.244 bln
+838.437 mln
3.58%
jan 1, 1998
25.428 bln
+1.184 bln
4.88%
jan 1, 1999
26.718 bln
+1.29 bln
5.07%
jan 1, 2000
26.813 bln
+94.876 mln
0.36%
jan 1, 2001
27.021 bln
+208.609 mln
0.78%
jan 1, 2002
28.943 bln
+1.922 bln
7.11%
jan 1, 2003
27.967 bln
-976.116 mln
-3.37%
jan 1, 2004
28.375 bln
+408.823 mln
1.46%
jan 1, 2005
29.823 bln
+1.448 bln
5.1%
jan 1, 2006
31.97 bln
+2.146 bln
7.2%
jan 1, 2007
35.712 bln
+3.743 bln
11.71%
jan 1, 2008
37.972 bln
+2.26 bln
6.33%
jan 1, 2009
39.165 bln
+1.193 bln
3.14%
jan 1, 2010
41.721 bln
+2.557 bln
6.53%
jan 1, 2011
45.165 bln
+3.444 bln
8.25%
jan 1, 2012
48.626 bln
+3.461 bln
7.66%
jan 1, 2013
51.395 bln
+2.769 bln
5.69%
jan 1, 2014
53.753 bln
+2.358 bln
4.59%
jan 1, 2015
57.457 bln
+3.704 bln
6.89%
jan 1, 2016
60.125 bln
+2.668 bln
4.64%
Ranking of countries by current statistics by years


Comments: