29
/
en
AIzaSyAYiBZKx7MnpbEhh9jyipgxe19OcubqV5w
April 1, 2024
144442
Guatemala
GTM
true
2
1
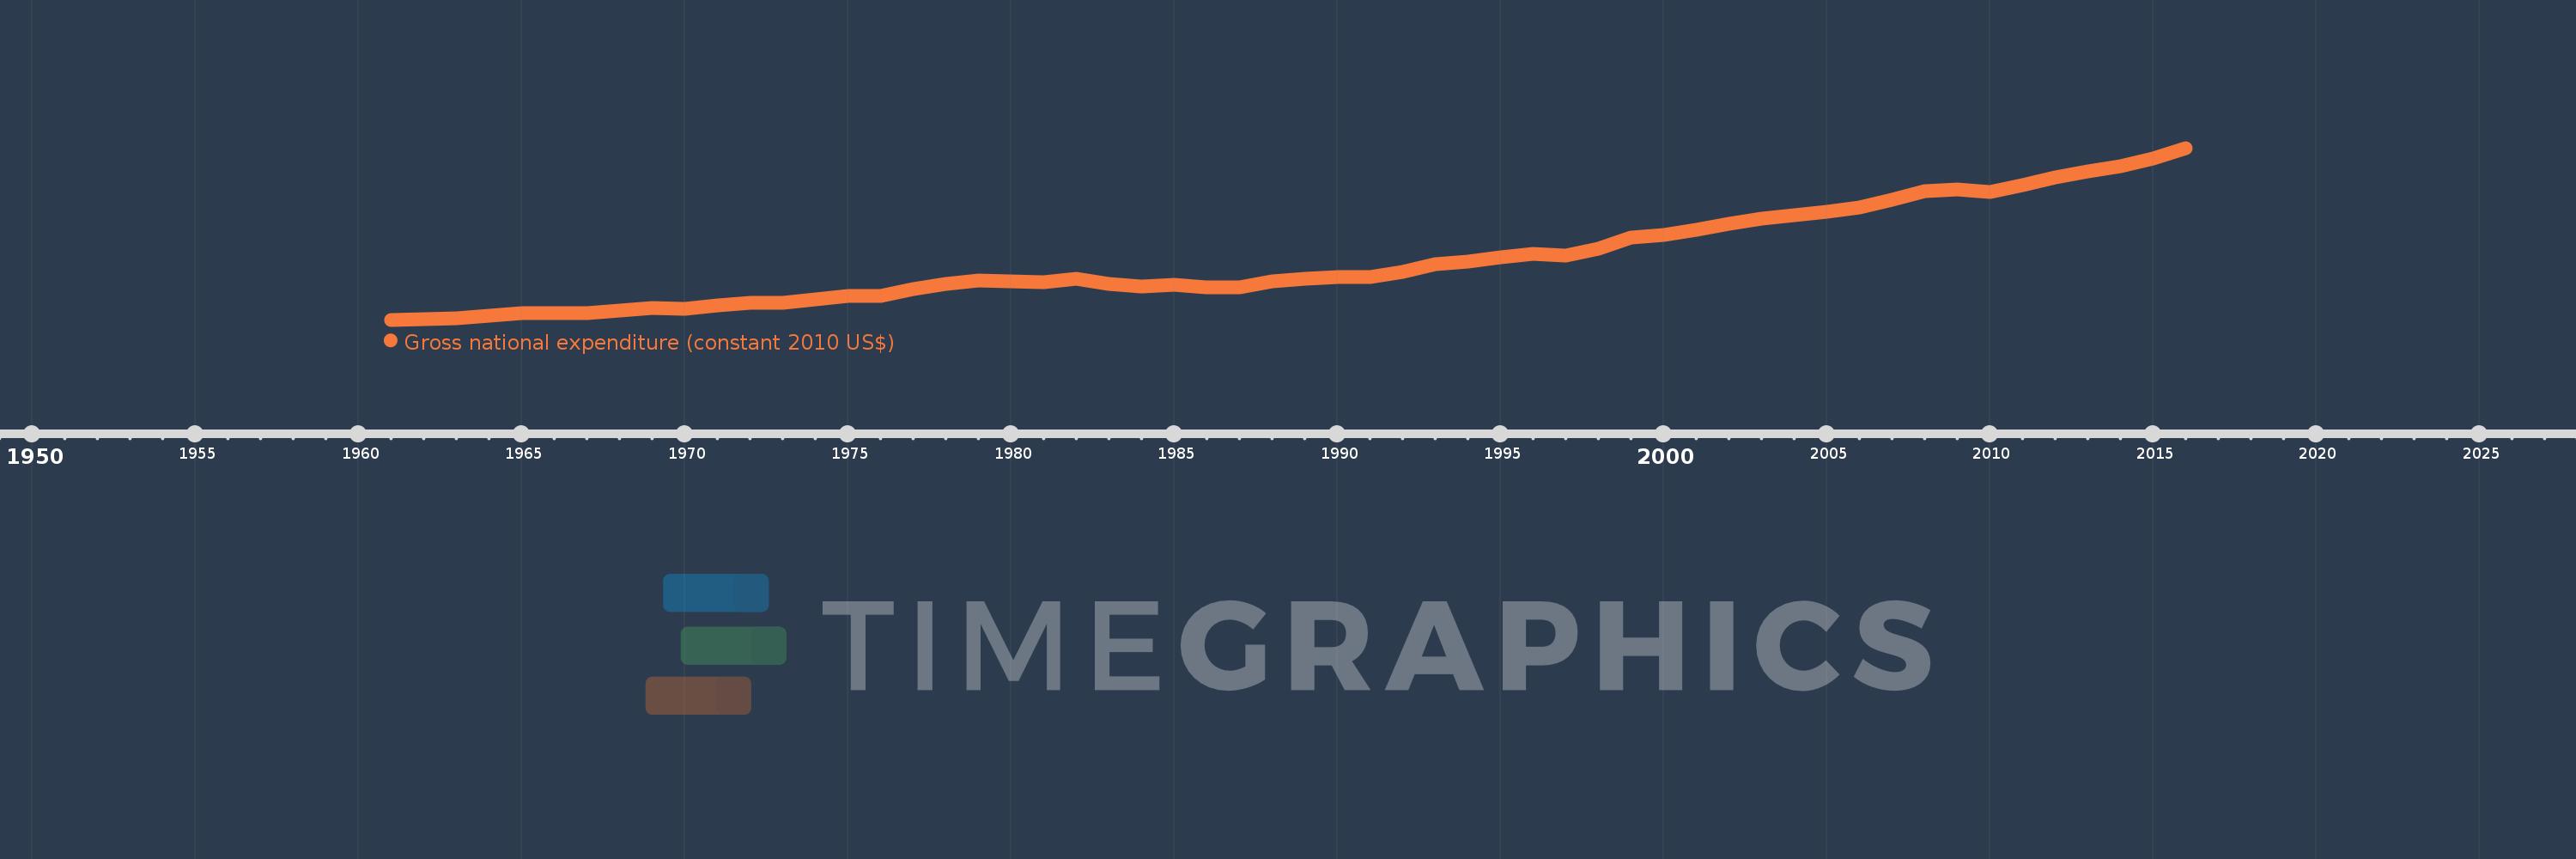
Gross national expenditure (constant 2010 US$)
2016,2015,2014,2013,2012,2011,2010,2009,2008,2007,2006,2005,2004,2003,2002,2001,2000,1999,1998,1997,1996,1995,1994,1993,1992,1991,1990,1989,1988,1987,1986,1985,1984,1983,1982,1981,1980,1979,1978,1977,1976,1975,1974,1973,1972,1971,1970,1969,1968,1967,1966,1965,1964,1963,1962,1961
This statistics in other country:
AfghanistanAlbaniaAlgeriaAngolaAntigua and BarbudaArab WorldArgentinaArmeniaArubaAustraliaAustriaAzerbaijanBahamas, TheBahrainBangladeshBarbadosBelarusBelgiumBelizeBeninBermudaBhutanBoliviaBosnia and HerzegovinaBotswanaBrazilBrunei DarussalamBulgariaBurkina FasoBurundiCabo VerdeCambodiaCameroonCanadaCaribbean small statesCentral African RepublicCentral Europe and the BalticsChadChileChinaColombiaComorosCongo, Dem. Rep.Congo, Rep.Costa RicaCote d'IvoireCroatiaCubaCyprusCzech RepublicDenmarkDominicaDominican RepublicEarly-demographic dividendEast Asia & PacificEast Asia & Pacific (excluding high income)East Asia & Pacific (IDA & IBRD countries)EcuadorEgypt, Arab Rep.El SalvadorEquatorial GuineaEritreaEstoniaEuro areaEurope & Central AsiaEurope & Central Asia (excluding high income)Europe & Central Asia (IDA & IBRD countries)European UnionFaroe IslandsFijiFinlandFragile and conflict affected situationsFranceGabonGambia, TheGeorgiaGermanyGhanaGreeceGrenadaGuatemalaGuineaGuinea-BissauGuyanaHaitiHeavily indebted poor countries (HIPC)High incomeHondurasHong Kong SAR, ChinaHungaryIBRD onlyIcelandIDA & IBRD totalIDA blendIDA onlyIDA totalIndiaIndonesiaIran, Islamic Rep.IraqIrelandIsraelItalyJamaicaJapanJordanKazakhstanKenyaKiribatiKorea, Rep.KosovoKuwaitKyrgyz RepublicLao PDRLate-demographic dividendLatin America & Caribbean Latin America & Caribbean (excluding high income)Latin America & the Caribbean (IDA & IBRD countries)LatviaLeast developed countries: UN classificationLebanonLiberiaLibyaLithuaniaLow & middle incomeLow incomeLower middle incomeLuxembourgMacao SAR, ChinaMacedonia, FYRMadagascarMalawiMalaysiaMaldivesMaliMaltaMauritaniaMauritiusMexicoMiddle East & North AfricaMiddle East & North Africa (excluding high income)Middle East & North Africa (IDA & IBRD countries)Middle incomeMoldovaMongoliaMontenegroMoroccoMozambiqueMyanmarNamibiaNepalNetherlandsNew ZealandNicaraguaNigerNigeriaNorth AmericaNorwayOECD membersOmanOther small statesPacific island small statesPakistanPalauPanamaParaguayPeruPhilippinesPolandPortugalPost-demographic dividendPre-demographic dividendPuerto RicoQatarRomaniaRussian FederationRwandaSamoaSaudi ArabiaSenegalSerbiaSeychellesSierra LeoneSingaporeSlovak RepublicSloveniaSmall statesSolomon IslandsSouth AfricaSouth AsiaSouth Asia (IDA & IBRD)South SudanSpainSri LankaSt. Kitts and NevisSt. LuciaSt. Vincent and the GrenadinesSub-Saharan Africa Sub-Saharan Africa (excluding high income)Sub-Saharan Africa (IDA & IBRD countries)SudanSurinameSwazilandSwedenSwitzerlandTajikistanTanzaniaThailandTimor-LesteTogoTongaTrinidad and TobagoTunisiaTurkeyTurkmenistanUgandaUkraineUnited Arab EmiratesUnited KingdomUnited StatesUpper middle incomeUruguayUzbekistanVanuatuVenezuela, RBVietnamWest Bank and GazaWorldYemen, Rep.ZambiaZimbabwe Timeline:
This timeline shows a graph from 1961 to 2016 of Guatemala. No data until 1960. Number of actual observations by date: 56.
Source name:
World Development Indicators
Source organization:
World Bank national accounts data, and OECD National Accounts data files.
Categories, topics:
Economy & Growth
Last updated:
apr 23, 2017
Indicators value changes by year
Minimum:
6.9 bln
jan 1, 1961
Maximum:
56.54 bln
jan 1, 2016
At the date of observation
Value
Absolute change
Change from previous value
jan 1, 1961
6.9 bln
+6.9 bln
0.0%
jan 1, 1962
6.962 bln
+62.754 mln
0.91%
jan 1, 1963
7.292 bln
+329.689 mln
4.74%
jan 1, 1964
7.995 bln
+702.889 mln
9.64%
jan 1, 1965
8.698 bln
+703.149 mln
8.8%
jan 1, 1966
8.93 bln
+231.894 mln
2.67%
jan 1, 1967
8.881 bln
-49.247 mln
-0.55%
jan 1, 1968
9.629 bln
+748.312 mln
8.43%
jan 1, 1969
10.198 bln
+569.34 mln
5.91%
jan 1, 1970
10.176 bln
-22.607 mln
-0.22%
jan 1, 1971
11.112 bln
+936.381 mln
9.2%
jan 1, 1972
11.813 bln
+701.352 mln
6.31%
jan 1, 1973
11.887 bln
+73.563 mln
0.62%
jan 1, 1974
12.709 bln
+822.363 mln
6.92%
jan 1, 1975
13.858 bln
+1.148 bln
9.04%
jan 1, 1976
13.714 bln
-143.332 mln
-1.03%
jan 1, 1977
15.837 bln
+2.122 bln
15.47%
jan 1, 1978
17.25 bln
+1.414 bln
8.93%
jan 1, 1979
18.35 bln
+1.1 bln
6.37%
jan 1, 1980
18.063 bln
-286.761 mln
-1.56%
jan 1, 1981
17.849 bln
-214.675 mln
-1.19%
jan 1, 1982
18.637 bln
+788.797 mln
4.42%
jan 1, 1983
17.246 bln
-1.391 bln
-7.46%
jan 1, 1984
16.433 bln
-812.927 mln
-4.71%
jan 1, 1985
16.922 bln
+488.038 mln
2.97%
jan 1, 1986
16.178 bln
-743.698 mln
-4.39%
jan 1, 1987
16.329 bln
+151.608 mln
0.94%
jan 1, 1988
18.096 bln
+1.767 bln
10.82%
jan 1, 1989
18.725 bln
+628.875 mln
3.48%
jan 1, 1990
19.149 bln
+424.278 mln
2.27%
jan 1, 1991
19.279 bln
+129.871 mln
0.68%
jan 1, 1992
20.626 bln
+1.346 bln
6.98%
jan 1, 1993
22.994 bln
+2.368 bln
11.48%
jan 1, 1994
23.781 bln
+787.138 mln
3.42%
jan 1, 1995
24.845 bln
+1.065 bln
4.48%
jan 1, 1996
25.815 bln
+969.446 mln
3.9%
jan 1, 1997
25.398 bln
-416.946 mln
-1.62%
jan 1, 1998
27.369 bln
+1.971 bln
7.76%
jan 1, 1999
30.694 bln
+3.326 bln
12.15%
jan 1, 2000
31.463 bln
+768.554 mln
2.5%
jan 1, 2001
32.854 bln
+1.391 bln
4.42%
jan 1, 2002
34.728 bln
+1.874 bln
5.7%
jan 1, 2003
36.099 bln
+1.371 bln
3.95%
jan 1, 2004
37.014 bln
+914.872 mln
2.53%
jan 1, 2005
38.08 bln
+1.067 bln
2.88%
jan 1, 2006
39.287 bln
+1.206 bln
3.17%
jan 1, 2007
41.6 bln
+2.314 bln
5.89%
jan 1, 2008
44.065 bln
+2.465 bln
5.92%
jan 1, 2009
44.449 bln
+384.33 mln
0.87%
jan 1, 2010
43.78 bln
-669.553 mln
-1.51%
jan 1, 2011
45.68 bln
+1.9 bln
4.34%
jan 1, 2012
48.131 bln
+2.451 bln
5.36%
jan 1, 2013
49.665 bln
+1.534 bln
3.19%
jan 1, 2014
51.263 bln
+1.598 bln
3.22%
jan 1, 2015
53.435 bln
+2.172 bln
4.24%
jan 1, 2016
56.54 bln
+3.105 bln
5.81%
Ranking of countries by current statistics by years


Comments: