29
/
en
AIzaSyAYiBZKx7MnpbEhh9jyipgxe19OcubqV5w
April 1, 2024
182146
Luxembourg
LUX
true
2
1
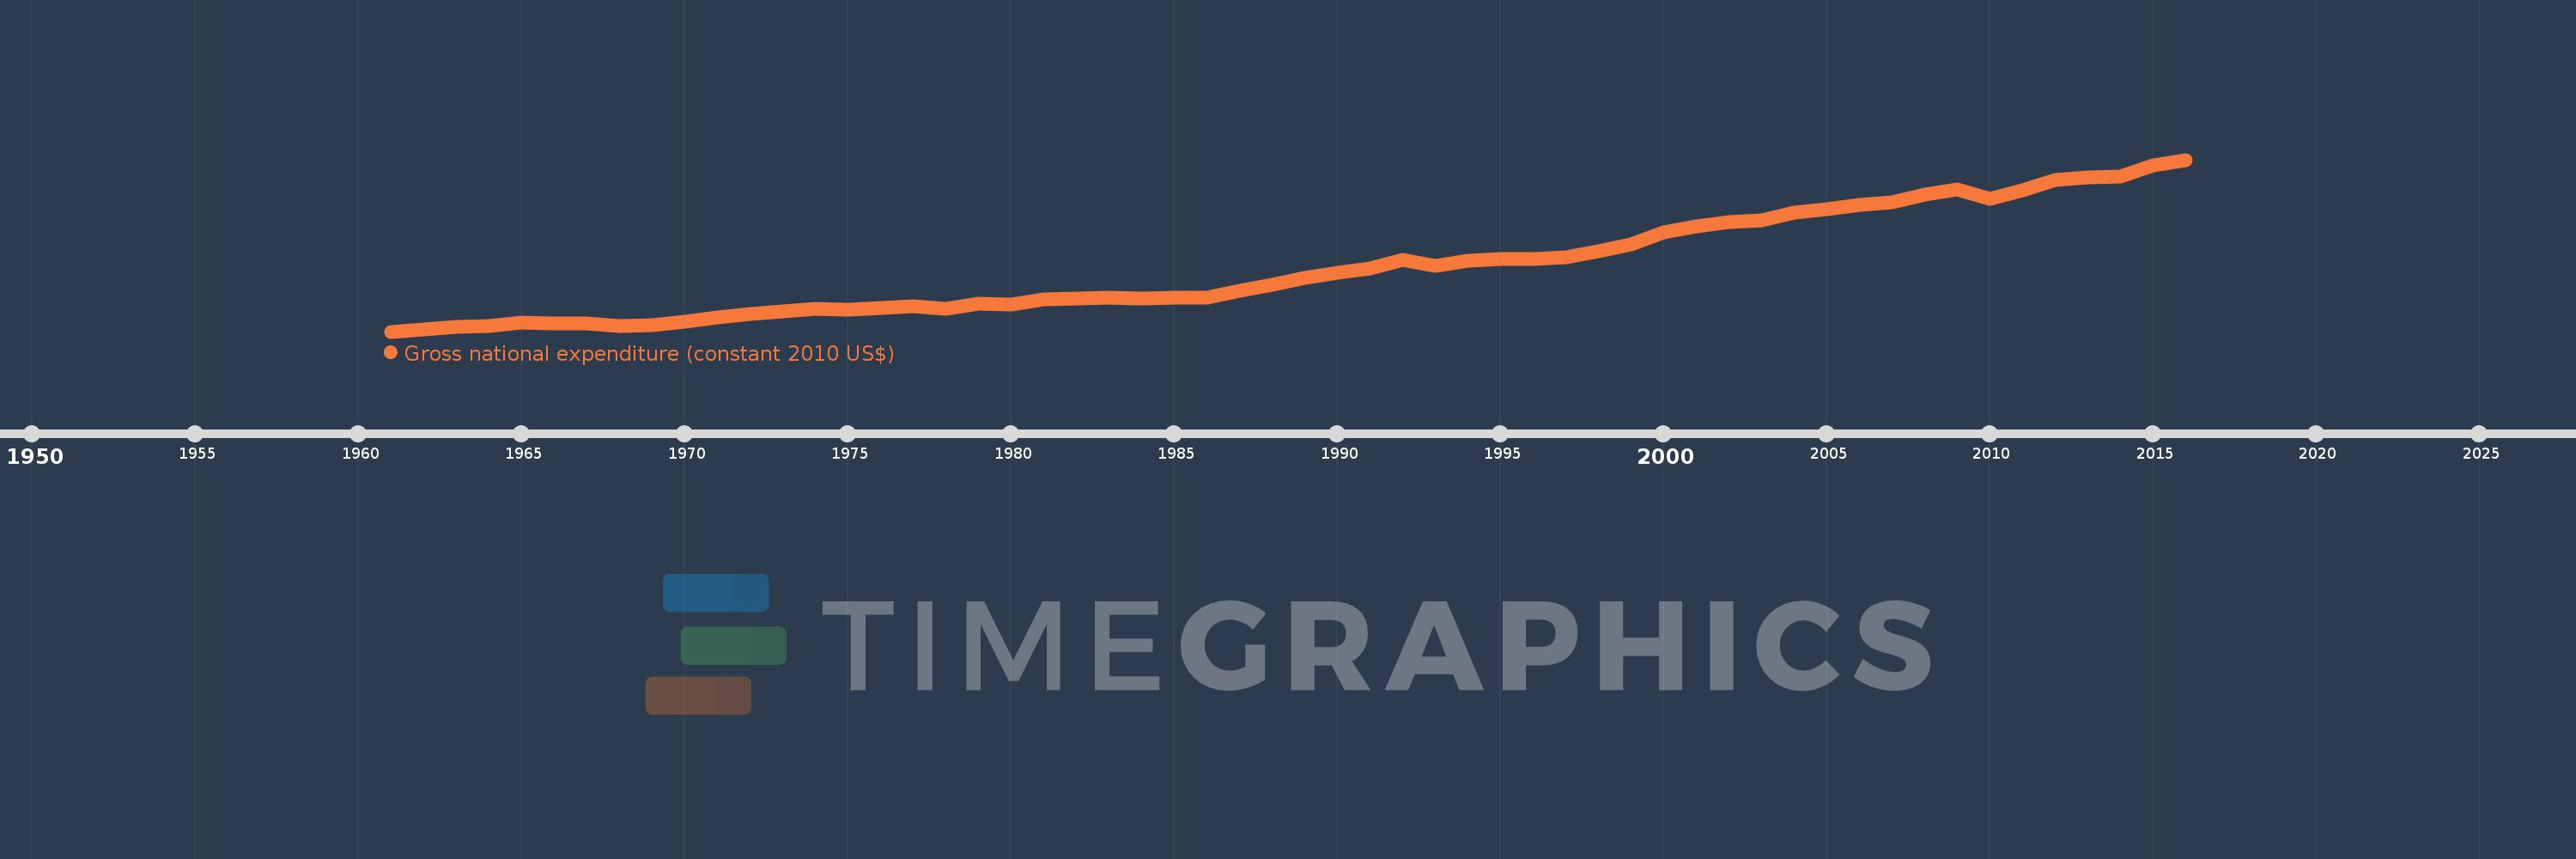
Gross national expenditure (constant 2010 US$)
2016,2015,2014,2013,2012,2011,2010,2009,2008,2007,2006,2005,2004,2003,2002,2001,2000,1999,1998,1997,1996,1995,1994,1993,1992,1991,1990,1989,1988,1987,1986,1985,1984,1983,1982,1981,1980,1979,1978,1977,1976,1975,1974,1973,1972,1971,1970,1969,1968,1967,1966,1965,1964,1963,1962,1961
This statistics in other country:
AfghanistanAlbaniaAlgeriaAngolaAntigua and BarbudaArab WorldArgentinaArmeniaArubaAustraliaAustriaAzerbaijanBahamas, TheBahrainBangladeshBarbadosBelarusBelgiumBelizeBeninBermudaBhutanBoliviaBosnia and HerzegovinaBotswanaBrazilBrunei DarussalamBulgariaBurkina FasoBurundiCabo VerdeCambodiaCameroonCanadaCaribbean small statesCentral African RepublicCentral Europe and the BalticsChadChileChinaColombiaComorosCongo, Dem. Rep.Congo, Rep.Costa RicaCote d'IvoireCroatiaCubaCyprusCzech RepublicDenmarkDominicaDominican RepublicEarly-demographic dividendEast Asia & PacificEast Asia & Pacific (excluding high income)East Asia & Pacific (IDA & IBRD countries)EcuadorEgypt, Arab Rep.El SalvadorEquatorial GuineaEritreaEstoniaEuro areaEurope & Central AsiaEurope & Central Asia (excluding high income)Europe & Central Asia (IDA & IBRD countries)European UnionFaroe IslandsFijiFinlandFragile and conflict affected situationsFranceGabonGambia, TheGeorgiaGermanyGhanaGreeceGrenadaGuatemalaGuineaGuinea-BissauGuyanaHaitiHeavily indebted poor countries (HIPC)High incomeHondurasHong Kong SAR, ChinaHungaryIBRD onlyIcelandIDA & IBRD totalIDA blendIDA onlyIDA totalIndiaIndonesiaIran, Islamic Rep.IraqIrelandIsraelItalyJamaicaJapanJordanKazakhstanKenyaKiribatiKorea, Rep.KosovoKuwaitKyrgyz RepublicLao PDRLate-demographic dividendLatin America & Caribbean Latin America & Caribbean (excluding high income)Latin America & the Caribbean (IDA & IBRD countries)LatviaLeast developed countries: UN classificationLebanonLiberiaLibyaLithuaniaLow & middle incomeLow incomeLower middle incomeLuxembourgMacao SAR, ChinaMacedonia, FYRMadagascarMalawiMalaysiaMaldivesMaliMaltaMauritaniaMauritiusMexicoMiddle East & North AfricaMiddle East & North Africa (excluding high income)Middle East & North Africa (IDA & IBRD countries)Middle incomeMoldovaMongoliaMontenegroMoroccoMozambiqueMyanmarNamibiaNepalNetherlandsNew ZealandNicaraguaNigerNigeriaNorth AmericaNorwayOECD membersOmanOther small statesPacific island small statesPakistanPalauPanamaParaguayPeruPhilippinesPolandPortugalPost-demographic dividendPre-demographic dividendPuerto RicoQatarRomaniaRussian FederationRwandaSamoaSaudi ArabiaSenegalSerbiaSeychellesSierra LeoneSingaporeSlovak RepublicSloveniaSmall statesSolomon IslandsSouth AfricaSouth AsiaSouth Asia (IDA & IBRD)South SudanSpainSri LankaSt. Kitts and NevisSt. LuciaSt. Vincent and the GrenadinesSub-Saharan Africa Sub-Saharan Africa (excluding high income)Sub-Saharan Africa (IDA & IBRD countries)SudanSurinameSwazilandSwedenSwitzerlandTajikistanTanzaniaThailandTimor-LesteTogoTongaTrinidad and TobagoTunisiaTurkeyTurkmenistanUgandaUkraineUnited Arab EmiratesUnited KingdomUnited StatesUpper middle incomeUruguayUzbekistanVanuatuVenezuela, RBVietnamWest Bank and GazaWorldYemen, Rep.ZambiaZimbabwe Timeline:
This timeline shows a graph from 1961 to 2016 of Luxembourg. No data until 1960. Number of actual observations by date: 56.
Source name:
World Development Indicators
Source organization:
World Bank national accounts data, and OECD National Accounts data files.
Categories, topics:
Economy & Growth
Last updated:
apr 23, 2017
Indicators value changes by year
Minimum:
7.577 bln
jan 1, 1961
Maximum:
41.799 bln
jan 1, 2016
At the date of observation
Value
Absolute change
Change from previous value
jan 1, 1961
7.577 bln
+7.577 bln
0.0%
jan 1, 1962
8.08 bln
+502.984 mln
6.64%
jan 1, 1963
8.491 bln
+410.515 mln
5.08%
jan 1, 1964
8.742 bln
+251.066 mln
2.96%
jan 1, 1965
9.422 bln
+680.65 mln
7.79%
jan 1, 1966
9.229 bln
-193.269 mln
-2.05%
jan 1, 1967
9.172 bln
-57.262 mln
-0.62%
jan 1, 1968
8.704 bln
-467.536 mln
-5.1%
jan 1, 1969
8.874 bln
+169.773 mln
1.95%
jan 1, 1970
9.51 bln
+635.787 mln
7.16%
jan 1, 1971
10.391 bln
+881.433 mln
9.27%
jan 1, 1972
11.068 bln
+677.132 mln
6.52%
jan 1, 1973
11.523 bln
+454.056 mln
4.1%
jan 1, 1974
12.135 bln
+612.013 mln
5.31%
jan 1, 1975
11.95 bln
-184.191 mln
-1.52%
jan 1, 1976
12.231 bln
+280.141 mln
2.34%
jan 1, 1977
12.58 bln
+349.212 mln
2.86%
jan 1, 1978
12.194 bln
-385.28 mln
-3.06%
jan 1, 1979
13.22 bln
+1.026 bln
8.41%
jan 1, 1980
13.037 bln
-183.777 mln
-1.39%
jan 1, 1981
13.912 bln
+874.947 mln
6.71%
jan 1, 1982
14.147 bln
+235.749 mln
1.69%
jan 1, 1983
14.317 bln
+169.926 mln
1.2%
jan 1, 1984
14.178 bln
-139.095 mln
-0.97%
jan 1, 1985
14.356 bln
+177.866 mln
1.25%
jan 1, 1986
14.288 bln
-67.786 mln
-0.47%
jan 1, 1987
15.665 bln
+1.376 bln
9.63%
jan 1, 1988
16.986 bln
+1.321 bln
8.43%
jan 1, 1989
18.256 bln
+1.27 bln
7.48%
jan 1, 1990
19.277 bln
+1.021 bln
5.59%
jan 1, 1991
20.162 bln
+885.553 mln
4.59%
jan 1, 1992
21.872 bln
+1.71 bln
8.48%
jan 1, 1993
20.748 bln
-1.124 bln
-5.14%
jan 1, 1994
21.703 bln
+954.544 mln
4.6%
jan 1, 1995
22.053 bln
+350.701 mln
1.62%
jan 1, 1996
22.073 bln
+19.185 mln
0.09%
jan 1, 1997
22.427 bln
+354.605 mln
1.61%
jan 1, 1998
23.617 bln
+1.19 bln
5.3%
jan 1, 1999
24.976 bln
+1.359 bln
5.75%
jan 1, 2000
27.259 bln
+2.283 bln
9.14%
jan 1, 2001
28.486 bln
+1.226 bln
4.5%
jan 1, 2002
29.316 bln
+830.718 mln
2.92%
jan 1, 2003
29.697 bln
+380.132 mln
1.3%
jan 1, 2004
31.205 bln
+1.508 bln
5.08%
jan 1, 2005
31.989 bln
+784.238 mln
2.51%
jan 1, 2006
32.896 bln
+906.623 mln
2.83%
jan 1, 2007
33.278 bln
+381.854 mln
1.16%
jan 1, 2008
34.809 bln
+1.531 bln
4.6%
jan 1, 2009
35.843 bln
+1.034 bln
2.97%
jan 1, 2010
33.931 bln
-1.912 bln
-5.33%
jan 1, 2011
35.662 bln
+1.731 bln
5.1%
jan 1, 2012
37.708 bln
+2.046 bln
5.74%
jan 1, 2013
38.258 bln
+549.669 mln
1.46%
jan 1, 2014
38.543 bln
+285.166 mln
0.75%
jan 1, 2015
40.725 bln
+2.182 bln
5.66%
jan 1, 2016
41.799 bln
+1.074 bln
2.64%
Ranking of countries by current statistics by years


Comments: