29
/
en
AIzaSyAYiBZKx7MnpbEhh9jyipgxe19OcubqV5w
April 1, 2024
91216
Brazil
BRA
true
2
1
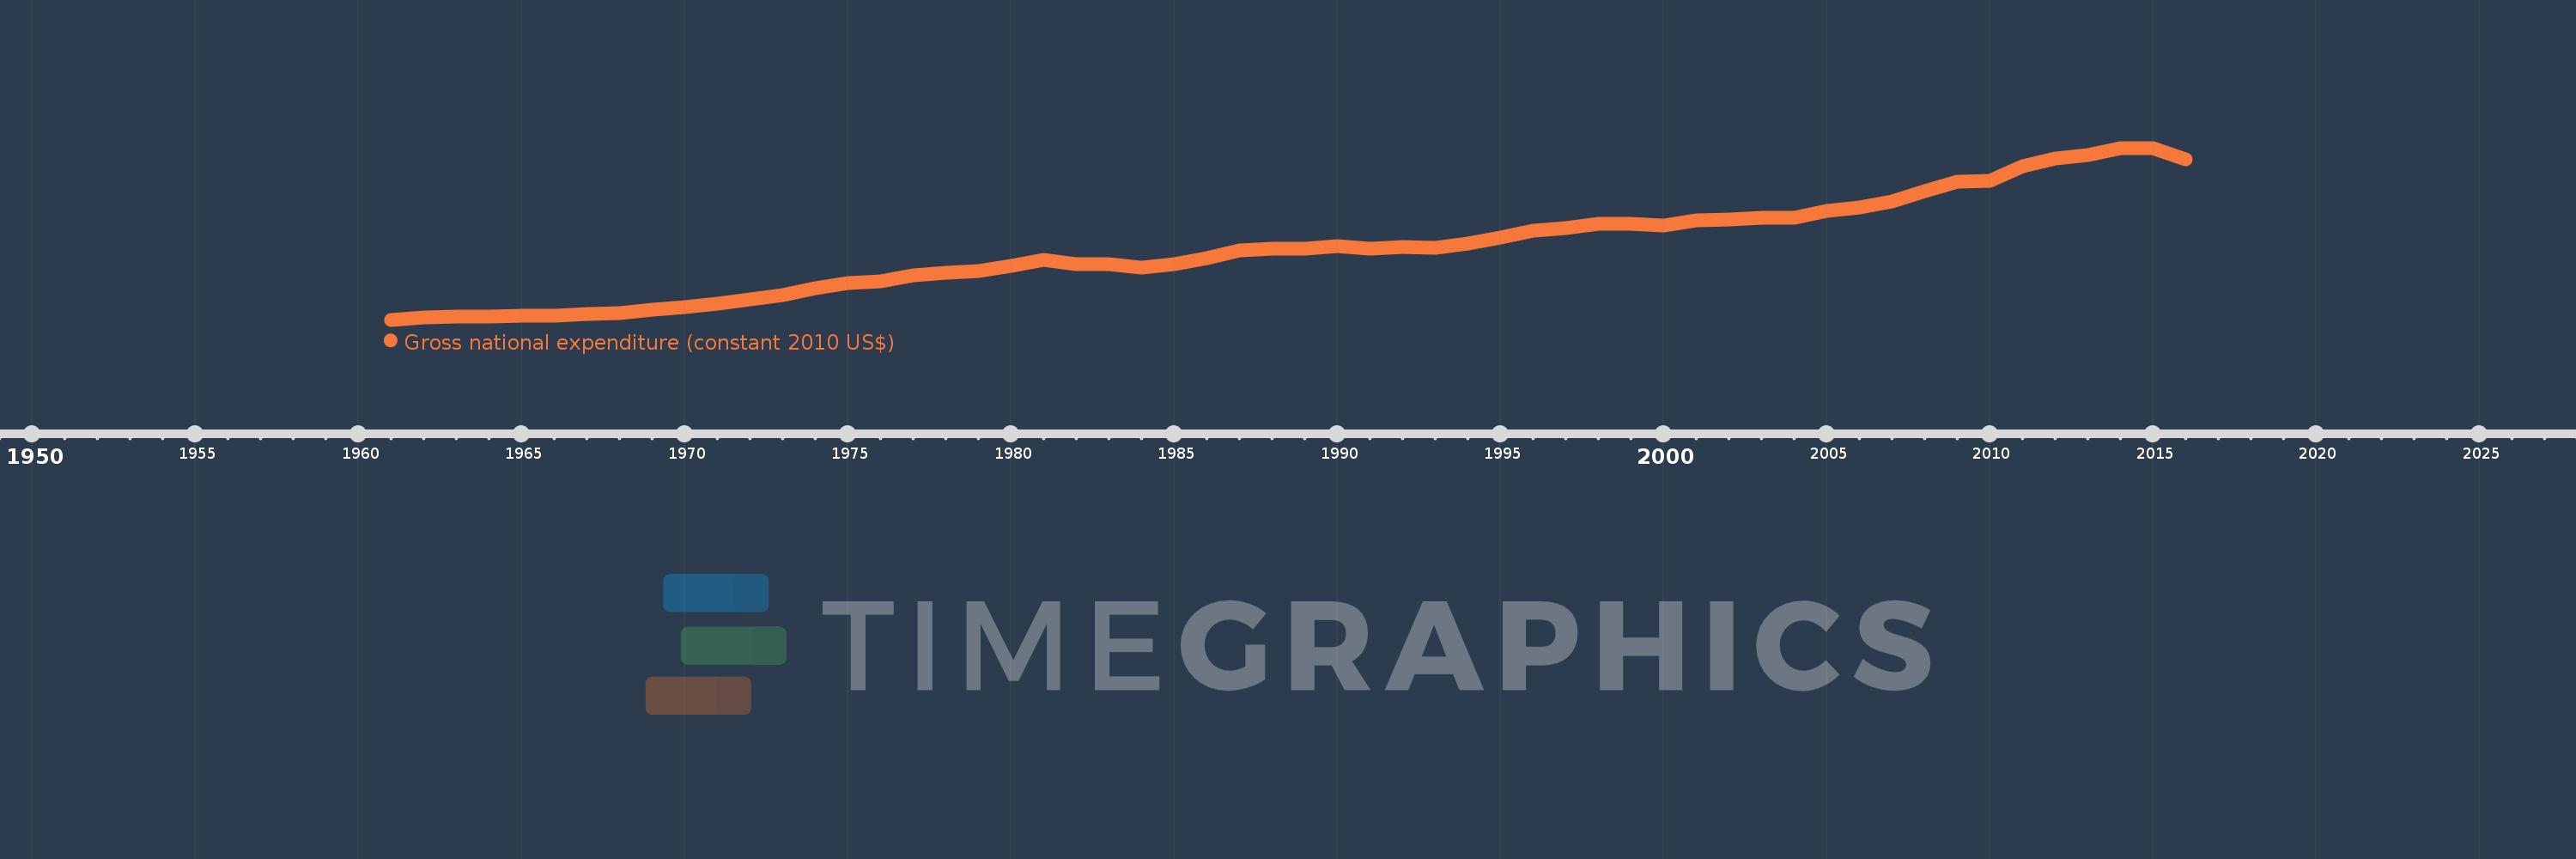
Gross national expenditure (constant 2010 US$)
2016,2015,2014,2013,2012,2011,2010,2009,2008,2007,2006,2005,2004,2003,2002,2001,2000,1999,1998,1997,1996,1995,1994,1993,1992,1991,1990,1989,1988,1987,1986,1985,1984,1983,1982,1981,1980,1979,1978,1977,1976,1975,1974,1973,1972,1971,1970,1969,1968,1967,1966,1965,1964,1963,1962,1961
This statistics in other country:
AfghanistanAlbaniaAlgeriaAngolaAntigua and BarbudaArab WorldArgentinaArmeniaArubaAustraliaAustriaAzerbaijanBahamas, TheBahrainBangladeshBarbadosBelarusBelgiumBelizeBeninBermudaBhutanBoliviaBosnia and HerzegovinaBotswanaBrazilBrunei DarussalamBulgariaBurkina FasoBurundiCabo VerdeCambodiaCameroonCanadaCaribbean small statesCentral African RepublicCentral Europe and the BalticsChadChileChinaColombiaComorosCongo, Dem. Rep.Congo, Rep.Costa RicaCote d'IvoireCroatiaCubaCyprusCzech RepublicDenmarkDominicaDominican RepublicEarly-demographic dividendEast Asia & PacificEast Asia & Pacific (excluding high income)East Asia & Pacific (IDA & IBRD countries)EcuadorEgypt, Arab Rep.El SalvadorEquatorial GuineaEritreaEstoniaEuro areaEurope & Central AsiaEurope & Central Asia (excluding high income)Europe & Central Asia (IDA & IBRD countries)European UnionFaroe IslandsFijiFinlandFragile and conflict affected situationsFranceGabonGambia, TheGeorgiaGermanyGhanaGreeceGrenadaGuatemalaGuineaGuinea-BissauGuyanaHaitiHeavily indebted poor countries (HIPC)High incomeHondurasHong Kong SAR, ChinaHungaryIBRD onlyIcelandIDA & IBRD totalIDA blendIDA onlyIDA totalIndiaIndonesiaIran, Islamic Rep.IraqIrelandIsraelItalyJamaicaJapanJordanKazakhstanKenyaKiribatiKorea, Rep.KosovoKuwaitKyrgyz RepublicLao PDRLate-demographic dividendLatin America & Caribbean Latin America & Caribbean (excluding high income)Latin America & the Caribbean (IDA & IBRD countries)LatviaLeast developed countries: UN classificationLebanonLiberiaLibyaLithuaniaLow & middle incomeLow incomeLower middle incomeLuxembourgMacao SAR, ChinaMacedonia, FYRMadagascarMalawiMalaysiaMaldivesMaliMaltaMauritaniaMauritiusMexicoMiddle East & North AfricaMiddle East & North Africa (excluding high income)Middle East & North Africa (IDA & IBRD countries)Middle incomeMoldovaMongoliaMontenegroMoroccoMozambiqueMyanmarNamibiaNepalNetherlandsNew ZealandNicaraguaNigerNigeriaNorth AmericaNorwayOECD membersOmanOther small statesPacific island small statesPakistanPalauPanamaParaguayPeruPhilippinesPolandPortugalPost-demographic dividendPre-demographic dividendPuerto RicoQatarRomaniaRussian FederationRwandaSamoaSaudi ArabiaSenegalSerbiaSeychellesSierra LeoneSingaporeSlovak RepublicSloveniaSmall statesSolomon IslandsSouth AfricaSouth AsiaSouth Asia (IDA & IBRD)South SudanSpainSri LankaSt. Kitts and NevisSt. LuciaSt. Vincent and the GrenadinesSub-Saharan Africa Sub-Saharan Africa (excluding high income)Sub-Saharan Africa (IDA & IBRD countries)SudanSurinameSwazilandSwedenSwitzerlandTajikistanTanzaniaThailandTimor-LesteTogoTongaTrinidad and TobagoTunisiaTurkeyTurkmenistanUgandaUkraineUnited Arab EmiratesUnited KingdomUnited StatesUpper middle incomeUruguayUzbekistanVanuatuVenezuela, RBVietnamWest Bank and GazaWorldYemen, Rep.ZambiaZimbabwe Timeline:
This timeline shows a graph from 1961 to 2016 of Brazil. No data until 1960. Number of actual observations by date: 56.
Source name:
World Development Indicators
Source organization:
World Bank national accounts data, and OECD National Accounts data files.
Categories, topics:
Economy & Growth
Last updated:
apr 23, 2017
Indicators value changes by year
Minimum:
251.015 bln
jan 1, 1961
Maximum:
2.464 trl
jan 1, 2015
At the date of observation
Value
Absolute change
Change from previous value
jan 1, 1961
251.015 bln
+251.015 bln
0.0%
jan 1, 1962
275.601 bln
+24.586 bln
9.79%
jan 1, 1963
290.203 bln
+14.602 bln
5.3%
jan 1, 1964
290.53 bln
+327.797 mln
0.11%
jan 1, 1965
300.455 bln
+9.924 bln
3.42%
jan 1, 1966
307.982 bln
+7.528 bln
2.51%
jan 1, 1967
322.361 bln
+14.379 bln
4.67%
jan 1, 1968
339.188 bln
+16.827 bln
5.22%
jan 1, 1969
378.91 bln
+39.721 bln
11.71%
jan 1, 1970
415.081 bln
+36.171 bln
9.55%
jan 1, 1971
454.129 bln
+39.048 bln
9.41%
jan 1, 1972
508.674 bln
+54.545 bln
12.01%
jan 1, 1973
570.293 bln
+61.619 bln
12.11%
jan 1, 1974
651.807 bln
+81.514 bln
14.29%
jan 1, 1975
718.7 bln
+66.894 bln
10.26%
jan 1, 1976
750.611 bln
+31.91 bln
4.44%
jan 1, 1977
821.586 bln
+70.976 bln
9.46%
jan 1, 1978
855.398 bln
+33.811 bln
4.12%
jan 1, 1979
881.442 bln
+26.044 bln
3.04%
jan 1, 1980
941.058 bln
+59.616 bln
6.76%
jan 1, 1981
1.02 trl
+78.517 bln
8.34%
jan 1, 1982
963.019 bln
-56.556 bln
-5.55%
jan 1, 1983
969.866 bln
+6.847 bln
0.71%
jan 1, 1984
925.437 bln
-44.429 bln
-4.58%
jan 1, 1985
964.993 bln
+39.556 bln
4.27%
jan 1, 1986
1.04 trl
+74.824 bln
7.75%
jan 1, 1987
1.139 trl
+98.877 bln
9.51%
jan 1, 1988
1.17 trl
+31.161 bln
2.74%
jan 1, 1989
1.161 trl
-8.995 bln
-0.77%
jan 1, 1990
1.2 trl
+38.949 bln
3.36%
jan 1, 1991
1.169 trl
-30.862 bln
-2.57%
jan 1, 1992
1.188 trl
+19.25 bln
1.65%
jan 1, 1993
1.173 trl
-14.977 bln
-1.26%
jan 1, 1994
1.234 trl
+60.771 bln
5.18%
jan 1, 1995
1.311 trl
+77.189 bln
6.26%
jan 1, 1996
1.397 trl
+85.427 bln
6.52%
jan 1, 1997
1.433 trl
+36.883 bln
2.64%
jan 1, 1998
1.488 trl
+54.154 bln
3.78%
jan 1, 1999
1.487 trl
-193.663 mln
-0.01%
jan 1, 2000
1.469 trl
-18.699 bln
-1.26%
jan 1, 2001
1.526 trl
+57.681 bln
3.93%
jan 1, 2002
1.544 trl
+17.563 bln
1.15%
jan 1, 2003
1.566 trl
+21.862 bln
1.42%
jan 1, 2004
1.567 trl
+1.26 bln
0.08%
jan 1, 2005
1.648 trl
+80.715 bln
5.15%
jan 1, 2006
1.693 trl
+45.535 bln
2.76%
jan 1, 2007
1.776 trl
+82.884 bln
4.89%
jan 1, 2008
1.904 trl
+127.935 bln
7.2%
jan 1, 2009
2.034 trl
+129.392 bln
6.8%
jan 1, 2010
2.037 trl
+3.024 bln
0.15%
jan 1, 2011
2.232 trl
+195.264 bln
9.59%
jan 1, 2012
2.331 trl
+99.528 bln
4.46%
jan 1, 2013
2.377 trl
+45.356 bln
1.95%
jan 1, 2014
2.462 trl
+85.329 bln
3.59%
jan 1, 2015
2.464 trl
+1.954 bln
0.08%
jan 1, 2016
2.312 trl
-151.755 bln
-6.16%
Ranking of countries by current statistics by years


Comments: