29
/
en
AIzaSyAYiBZKx7MnpbEhh9jyipgxe19OcubqV5w
April 1, 2024
164910
Jordan
JOR
true
2
1
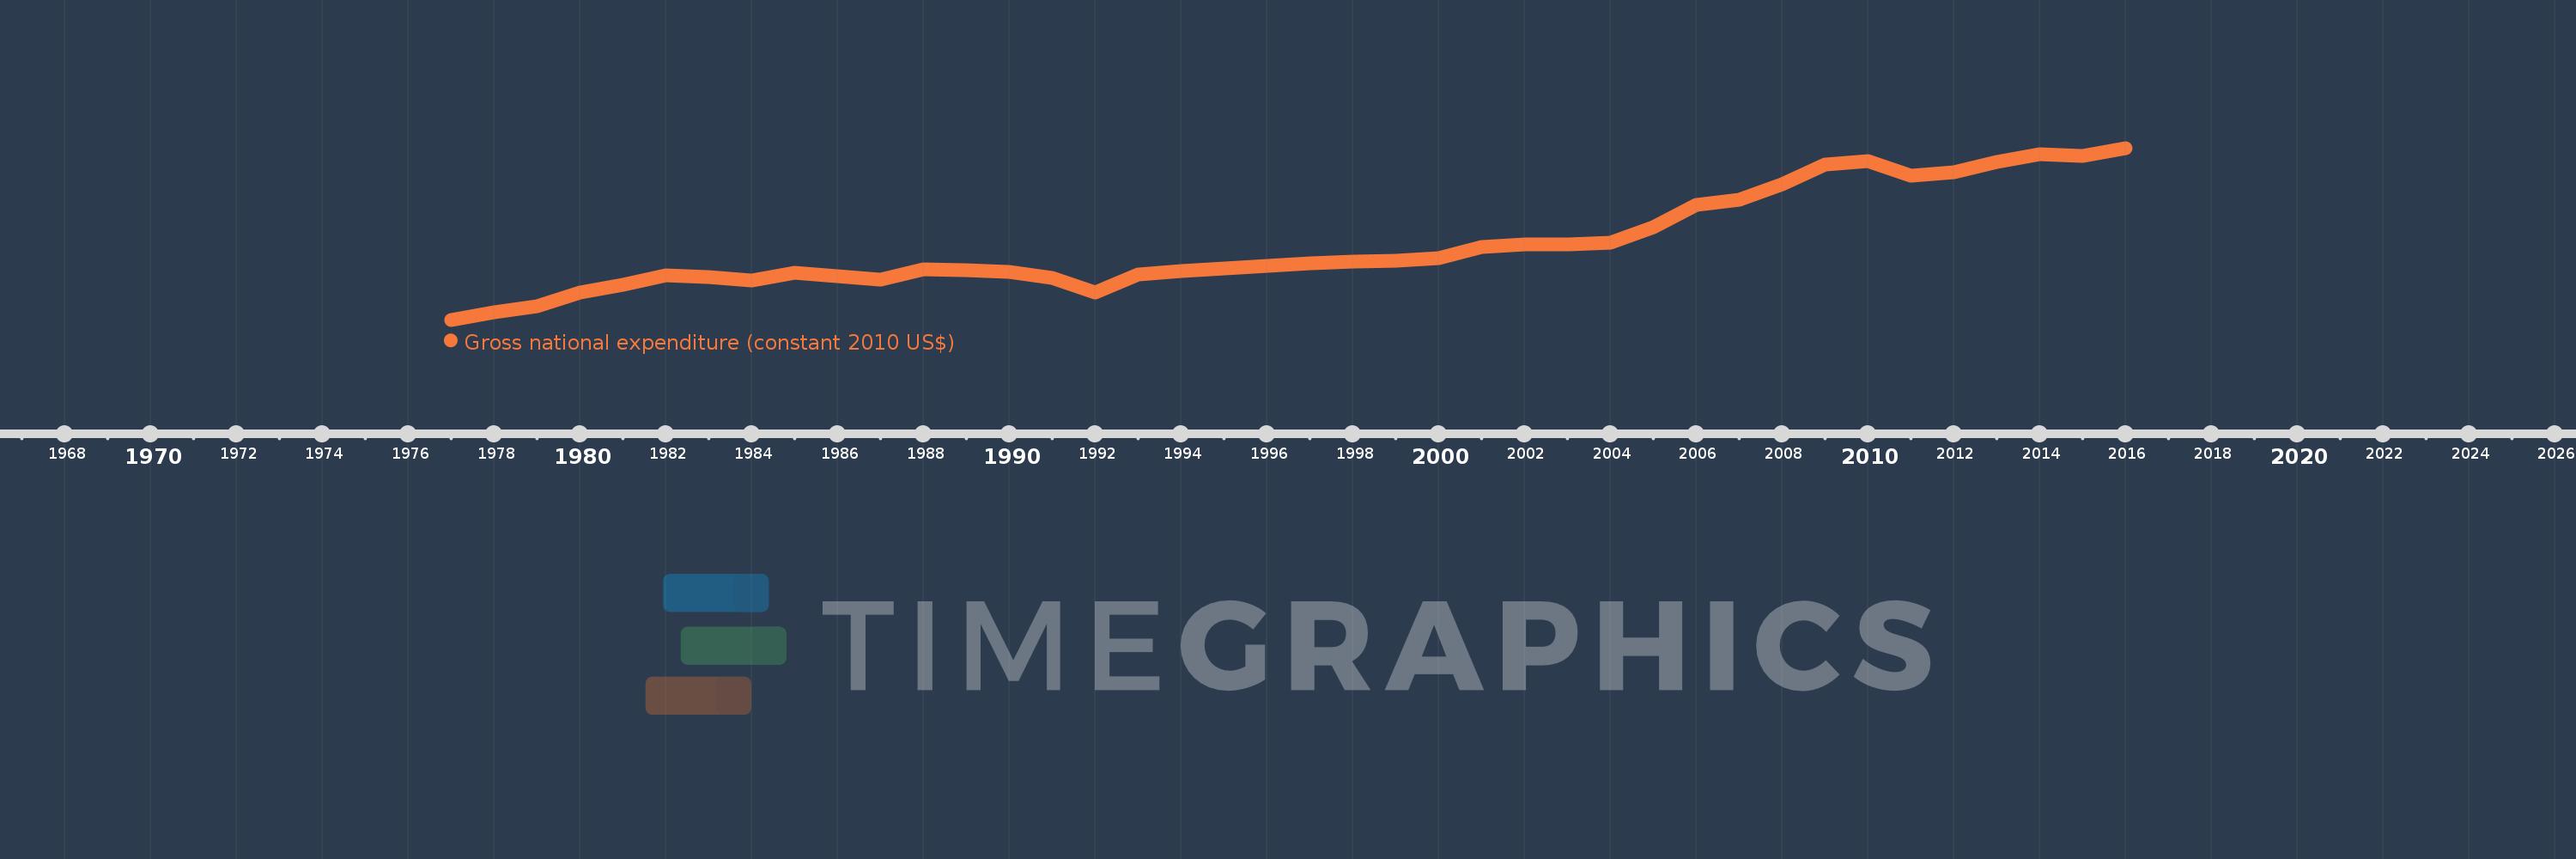
Gross national expenditure (constant 2010 US$)
2016,2015,2014,2013,2012,2011,2010,2009,2008,2007,2006,2005,2004,2003,2002,2001,2000,1999,1998,1997,1996,1995,1994,1993,1992,1991,1990,1989,1988,1987,1986,1985,1984,1983,1982,1981,1980,1979,1978,1977
This statistics in other country:
AfghanistanAlbaniaAlgeriaAngolaAntigua and BarbudaArab WorldArgentinaArmeniaArubaAustraliaAustriaAzerbaijanBahamas, TheBahrainBangladeshBarbadosBelarusBelgiumBelizeBeninBermudaBhutanBoliviaBosnia and HerzegovinaBotswanaBrazilBrunei DarussalamBulgariaBurkina FasoBurundiCabo VerdeCambodiaCameroonCanadaCaribbean small statesCentral African RepublicCentral Europe and the BalticsChadChileChinaColombiaComorosCongo, Dem. Rep.Congo, Rep.Costa RicaCote d'IvoireCroatiaCubaCyprusCzech RepublicDenmarkDominicaDominican RepublicEarly-demographic dividendEast Asia & PacificEast Asia & Pacific (excluding high income)East Asia & Pacific (IDA & IBRD countries)EcuadorEgypt, Arab Rep.El SalvadorEquatorial GuineaEritreaEstoniaEuro areaEurope & Central AsiaEurope & Central Asia (excluding high income)Europe & Central Asia (IDA & IBRD countries)European UnionFaroe IslandsFijiFinlandFragile and conflict affected situationsFranceGabonGambia, TheGeorgiaGermanyGhanaGreeceGrenadaGuatemalaGuineaGuinea-BissauGuyanaHaitiHeavily indebted poor countries (HIPC)High incomeHondurasHong Kong SAR, ChinaHungaryIBRD onlyIcelandIDA & IBRD totalIDA blendIDA onlyIDA totalIndiaIndonesiaIran, Islamic Rep.IraqIrelandIsraelItalyJamaicaJapanJordanKazakhstanKenyaKiribatiKorea, Rep.KosovoKuwaitKyrgyz RepublicLao PDRLate-demographic dividendLatin America & Caribbean Latin America & Caribbean (excluding high income)Latin America & the Caribbean (IDA & IBRD countries)LatviaLeast developed countries: UN classificationLebanonLiberiaLibyaLithuaniaLow & middle incomeLow incomeLower middle incomeLuxembourgMacao SAR, ChinaMacedonia, FYRMadagascarMalawiMalaysiaMaldivesMaliMaltaMauritaniaMauritiusMexicoMiddle East & North AfricaMiddle East & North Africa (excluding high income)Middle East & North Africa (IDA & IBRD countries)Middle incomeMoldovaMongoliaMontenegroMoroccoMozambiqueMyanmarNamibiaNepalNetherlandsNew ZealandNicaraguaNigerNigeriaNorth AmericaNorwayOECD membersOmanOther small statesPacific island small statesPakistanPalauPanamaParaguayPeruPhilippinesPolandPortugalPost-demographic dividendPre-demographic dividendPuerto RicoQatarRomaniaRussian FederationRwandaSamoaSaudi ArabiaSenegalSerbiaSeychellesSierra LeoneSingaporeSlovak RepublicSloveniaSmall statesSolomon IslandsSouth AfricaSouth AsiaSouth Asia (IDA & IBRD)South SudanSpainSri LankaSt. Kitts and NevisSt. LuciaSt. Vincent and the GrenadinesSub-Saharan Africa Sub-Saharan Africa (excluding high income)Sub-Saharan Africa (IDA & IBRD countries)SudanSurinameSwazilandSwedenSwitzerlandTajikistanTanzaniaThailandTimor-LesteTogoTongaTrinidad and TobagoTunisiaTurkeyTurkmenistanUgandaUkraineUnited Arab EmiratesUnited KingdomUnited StatesUpper middle incomeUruguayUzbekistanVanuatuVenezuela, RBVietnamWest Bank and GazaWorldYemen, Rep.ZambiaZimbabwe Timeline:
This timeline shows a graph from 1977 to 2016 of Jordan. No data until 1976. Number of actual observations by date: 40.
Source name:
World Development Indicators
Source organization:
World Bank national accounts data, and OECD National Accounts data files.
Categories, topics:
Economy & Growth
Last updated:
apr 23, 2017
Indicators value changes by year
Minimum:
7.032 bln
jan 1, 1977
Maximum:
36.634 bln
jan 1, 2016
At the date of observation
Value
Absolute change
Change from previous value
jan 1, 1977
7.032 bln
+7.032 bln
0.0%
jan 1, 1978
8.247 bln
+1.216 bln
17.29%
jan 1, 1979
9.375 bln
+1.128 bln
13.68%
jan 1, 1980
11.726 bln
+2.351 bln
25.07%
jan 1, 1981
12.989 bln
+1.264 bln
10.78%
jan 1, 1982
14.612 bln
+1.623 bln
12.49%
jan 1, 1983
14.404 bln
-208.356 mln
-1.43%
jan 1, 1984
13.828 bln
-576.026 mln
-4.0%
jan 1, 1985
15.185 bln
+1.358 bln
9.82%
jan 1, 1986
14.565 bln
-620.44 mln
-4.09%
jan 1, 1987
13.906 bln
-658.474 mln
-4.52%
jan 1, 1988
15.686 bln
+1.779 bln
12.79%
jan 1, 1989
15.509 bln
-176.522 mln
-1.13%
jan 1, 1990
15.347 bln
-162.474 mln
-1.05%
jan 1, 1991
14.196 bln
-1.151 bln
-7.5%
jan 1, 1992
11.679 bln
-2.517 bln
-17.73%
jan 1, 1993
14.861 bln
+3.183 bln
27.25%
jan 1, 1994
15.495 bln
+634.222 mln
4.27%
jan 1, 1995
15.881 bln
+385.747 mln
2.49%
jan 1, 1996
16.289 bln
+408.192 mln
2.57%
jan 1, 1997
16.783 bln
+493.768 mln
3.03%
jan 1, 1998
17.021 bln
+237.569 mln
1.42%
jan 1, 1999
17.188 bln
+166.86 mln
0.98%
jan 1, 2000
17.573 bln
+385.811 mln
2.24%
jan 1, 2001
19.5 bln
+1.926 bln
10.96%
jan 1, 2002
20.066 bln
+566.467 mln
2.9%
jan 1, 2003
20.053 bln
-12.822 mln
-0.06%
jan 1, 2004
20.333 bln
+279.597 mln
1.39%
jan 1, 2005
23.046 bln
+2.713 bln
13.34%
jan 1, 2006
26.844 bln
+3.798 bln
16.48%
jan 1, 2007
27.741 bln
+896.288 mln
3.34%
jan 1, 2008
30.381 bln
+2.64 bln
9.52%
jan 1, 2009
33.79 bln
+3.41 bln
11.22%
jan 1, 2010
34.397 bln
+606.567 mln
1.8%
jan 1, 2011
31.922 bln
-2.474 bln
-7.19%
jan 1, 2012
32.431 bln
+508.24 mln
1.59%
jan 1, 2013
34.263 bln
+1.833 bln
5.65%
jan 1, 2014
35.542 bln
+1.279 bln
3.73%
jan 1, 2015
35.309 bln
-232.895 mln
-0.66%
jan 1, 2016
36.634 bln
+1.325 bln
3.75%
Ranking of countries by current statistics by years


Comments: