29
/
en
AIzaSyAYiBZKx7MnpbEhh9jyipgxe19OcubqV5w
April 1, 2024
45133
Low & middle income
LMY
false
2
1
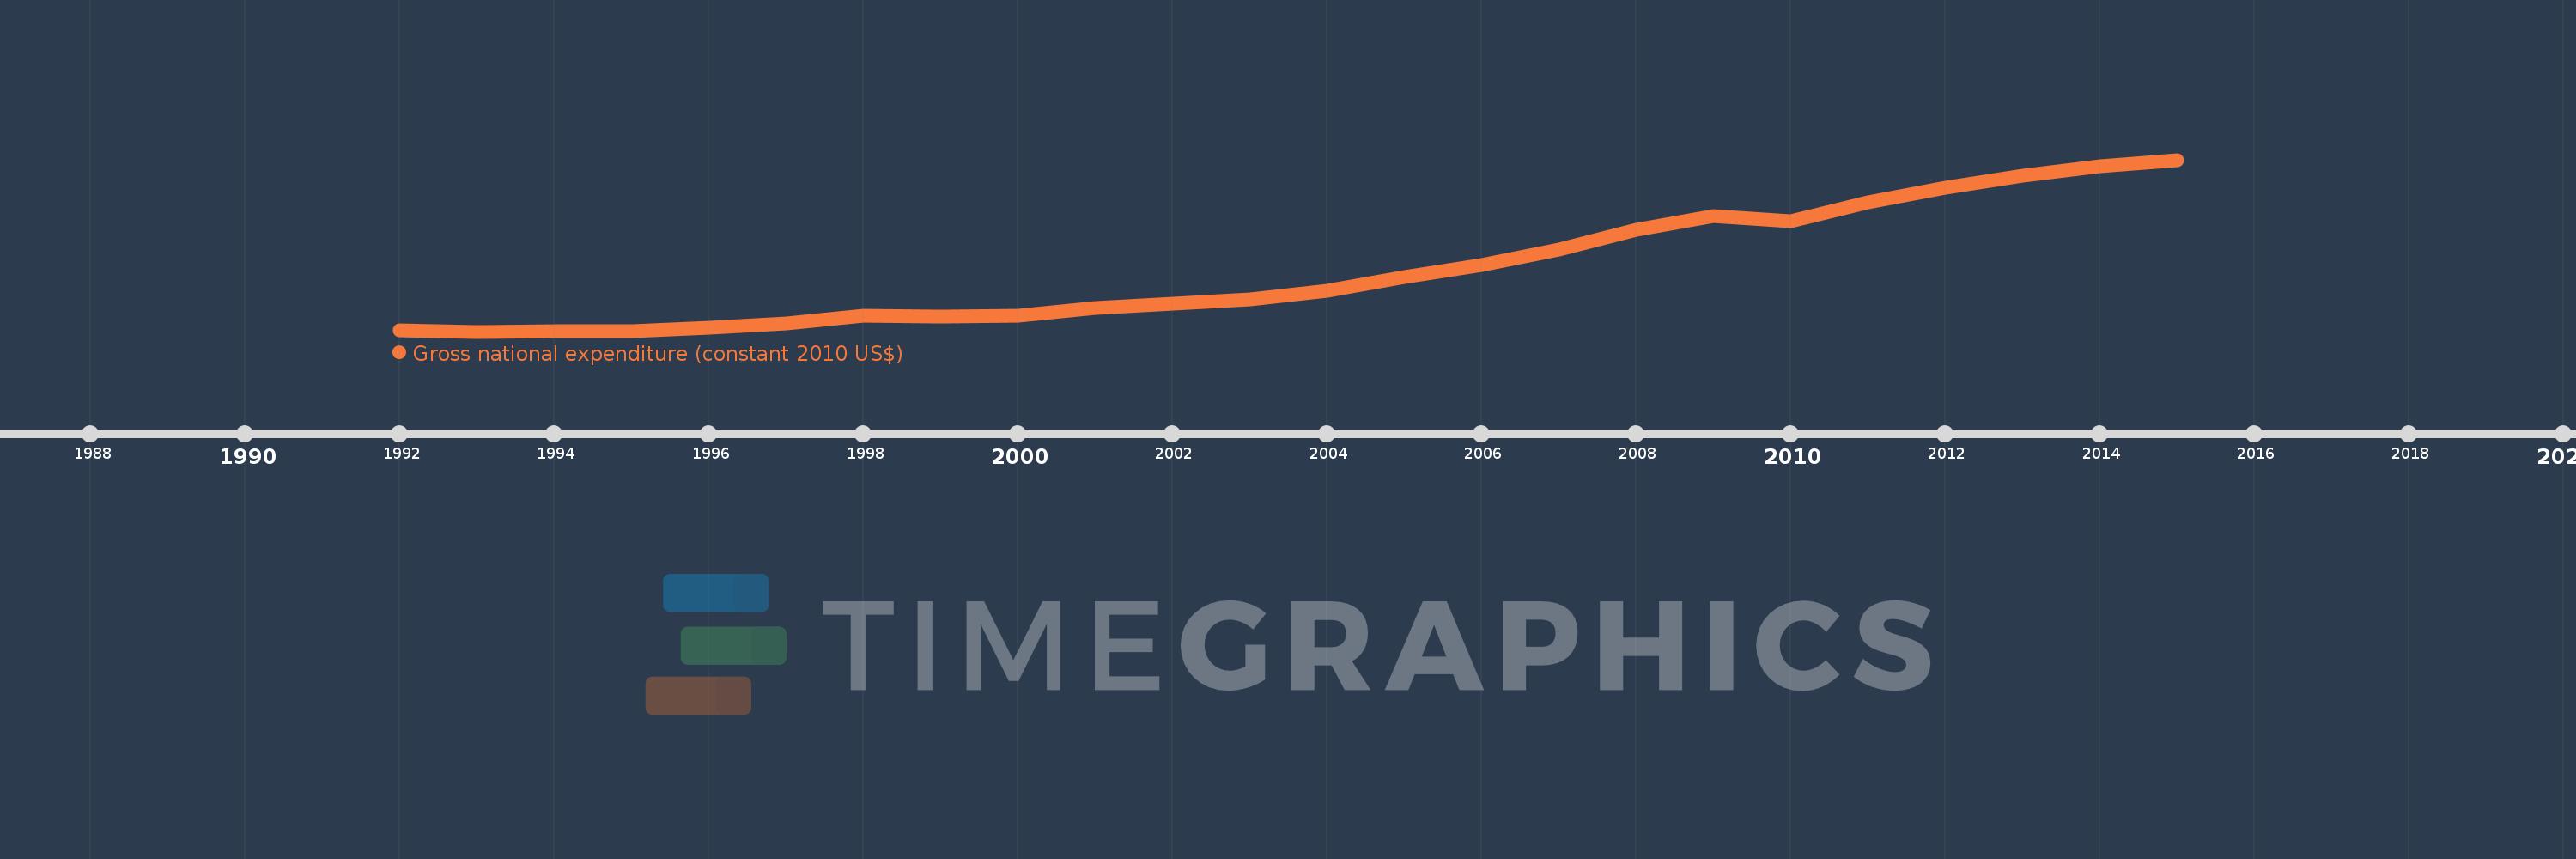
Gross national expenditure (constant 2010 US$)
2015,2014,2013,2012,2011,2010,2009,2008,2007,2006,2005,2004,2003,2002,2001,2000,1999,1998,1997,1996,1995,1994,1993,1992
This statistics in other country:
AfghanistanAlbaniaAlgeriaAngolaAntigua and BarbudaArab WorldArgentinaArmeniaArubaAustraliaAustriaAzerbaijanBahamas, TheBahrainBangladeshBarbadosBelarusBelgiumBelizeBeninBermudaBhutanBoliviaBosnia and HerzegovinaBotswanaBrazilBrunei DarussalamBulgariaBurkina FasoBurundiCabo VerdeCambodiaCameroonCanadaCaribbean small statesCentral African RepublicCentral Europe and the BalticsChadChileChinaColombiaComorosCongo, Dem. Rep.Congo, Rep.Costa RicaCote d'IvoireCroatiaCubaCyprusCzech RepublicDenmarkDominicaDominican RepublicEarly-demographic dividendEast Asia & PacificEast Asia & Pacific (excluding high income)East Asia & Pacific (IDA & IBRD countries)EcuadorEgypt, Arab Rep.El SalvadorEquatorial GuineaEritreaEstoniaEuro areaEurope & Central AsiaEurope & Central Asia (excluding high income)Europe & Central Asia (IDA & IBRD countries)European UnionFaroe IslandsFijiFinlandFragile and conflict affected situationsFranceGabonGambia, TheGeorgiaGermanyGhanaGreeceGrenadaGuatemalaGuineaGuinea-BissauGuyanaHaitiHeavily indebted poor countries (HIPC)High incomeHondurasHong Kong SAR, ChinaHungaryIBRD onlyIcelandIDA & IBRD totalIDA blendIDA onlyIDA totalIndiaIndonesiaIran, Islamic Rep.IraqIrelandIsraelItalyJamaicaJapanJordanKazakhstanKenyaKiribatiKorea, Rep.KosovoKuwaitKyrgyz RepublicLao PDRLate-demographic dividendLatin America & Caribbean Latin America & Caribbean (excluding high income)Latin America & the Caribbean (IDA & IBRD countries)LatviaLeast developed countries: UN classificationLebanonLiberiaLibyaLithuaniaLow & middle incomeLow incomeLower middle incomeLuxembourgMacao SAR, ChinaMacedonia, FYRMadagascarMalawiMalaysiaMaldivesMaliMaltaMauritaniaMauritiusMexicoMiddle East & North AfricaMiddle East & North Africa (excluding high income)Middle East & North Africa (IDA & IBRD countries)Middle incomeMoldovaMongoliaMontenegroMoroccoMozambiqueMyanmarNamibiaNepalNetherlandsNew ZealandNicaraguaNigerNigeriaNorth AmericaNorwayOECD membersOmanOther small statesPacific island small statesPakistanPalauPanamaParaguayPeruPhilippinesPolandPortugalPost-demographic dividendPre-demographic dividendPuerto RicoQatarRomaniaRussian FederationRwandaSamoaSaudi ArabiaSenegalSerbiaSeychellesSierra LeoneSingaporeSlovak RepublicSloveniaSmall statesSolomon IslandsSouth AfricaSouth AsiaSouth Asia (IDA & IBRD)South SudanSpainSri LankaSt. Kitts and NevisSt. LuciaSt. Vincent and the GrenadinesSub-Saharan Africa Sub-Saharan Africa (excluding high income)Sub-Saharan Africa (IDA & IBRD countries)SudanSurinameSwazilandSwedenSwitzerlandTajikistanTanzaniaThailandTimor-LesteTogoTongaTrinidad and TobagoTunisiaTurkeyTurkmenistanUgandaUkraineUnited Arab EmiratesUnited KingdomUnited StatesUpper middle incomeUruguayUzbekistanVanuatuVenezuela, RBVietnamWest Bank and GazaWorldYemen, Rep.ZambiaZimbabwe Timeline:
This timeline shows a graph from 1992 to 2015 of Low & middle income. No data until 1991. Number of actual observations by date: 24.
Source name:
World Development Indicators
Source organization:
World Bank national accounts data, and OECD National Accounts data files.
Categories, topics:
Economy & Growth
Last updated:
apr 23, 2017
Indicators value changes by year
Minimum:
10.478 trl
jan 1, 1993
Maximum:
23.582 trl
jan 1, 2015
At the date of observation
Value
Absolute change
Change from previous value
jan 1, 1992
10.55 trl
+10.55 trl
0.0%
jan 1, 1993
10.478 trl
-71.724 bln
-0.68%
jan 1, 1994
10.478 trl
+349.432 mln
0.0%
jan 1, 1995
10.505 trl
+27.081 bln
0.26%
jan 1, 1996
10.752 trl
+246.609 bln
2.35%
jan 1, 1997
11.125 trl
+373.607 bln
3.47%
jan 1, 1998
11.684 trl
+558.604 bln
5.02%
jan 1, 1999
11.62 trl
-64.542 bln
-0.55%
jan 1, 2000
11.695 trl
+75.172 bln
0.65%
jan 1, 2001
12.302 trl
+607.426 bln
5.19%
jan 1, 2002
12.633 trl
+331.131 bln
2.69%
jan 1, 2003
12.942 trl
+309.015 bln
2.45%
jan 1, 2004
13.562 trl
+619.274 bln
4.78%
jan 1, 2005
14.606 trl
+1.045 trl
7.7%
jan 1, 2006
15.577 trl
+970.741 bln
6.65%
jan 1, 2007
16.721 trl
+1.144 trl
7.35%
jan 1, 2008
18.231 trl
+1.51 trl
9.03%
jan 1, 2009
19.26 trl
+1.029 trl
5.64%
jan 1, 2010
18.924 trl
-335.876 bln
-1.74%
jan 1, 2011
20.334 trl
+1.41 trl
7.45%
jan 1, 2012
21.483 trl
+1.149 trl
5.65%
jan 1, 2013
22.347 trl
+863.573 bln
4.02%
jan 1, 2014
23.106 trl
+759.221 bln
3.4%
jan 1, 2015
23.582 trl
+476.377 bln
2.06%
Ranking of countries by current statistics by years


Comments: