29
/
en
AIzaSyAYiBZKx7MnpbEhh9jyipgxe19OcubqV5w
April 1, 2024
50068
Middle East & North Africa (IDA & IBRD countries)
TMN
false
2
1
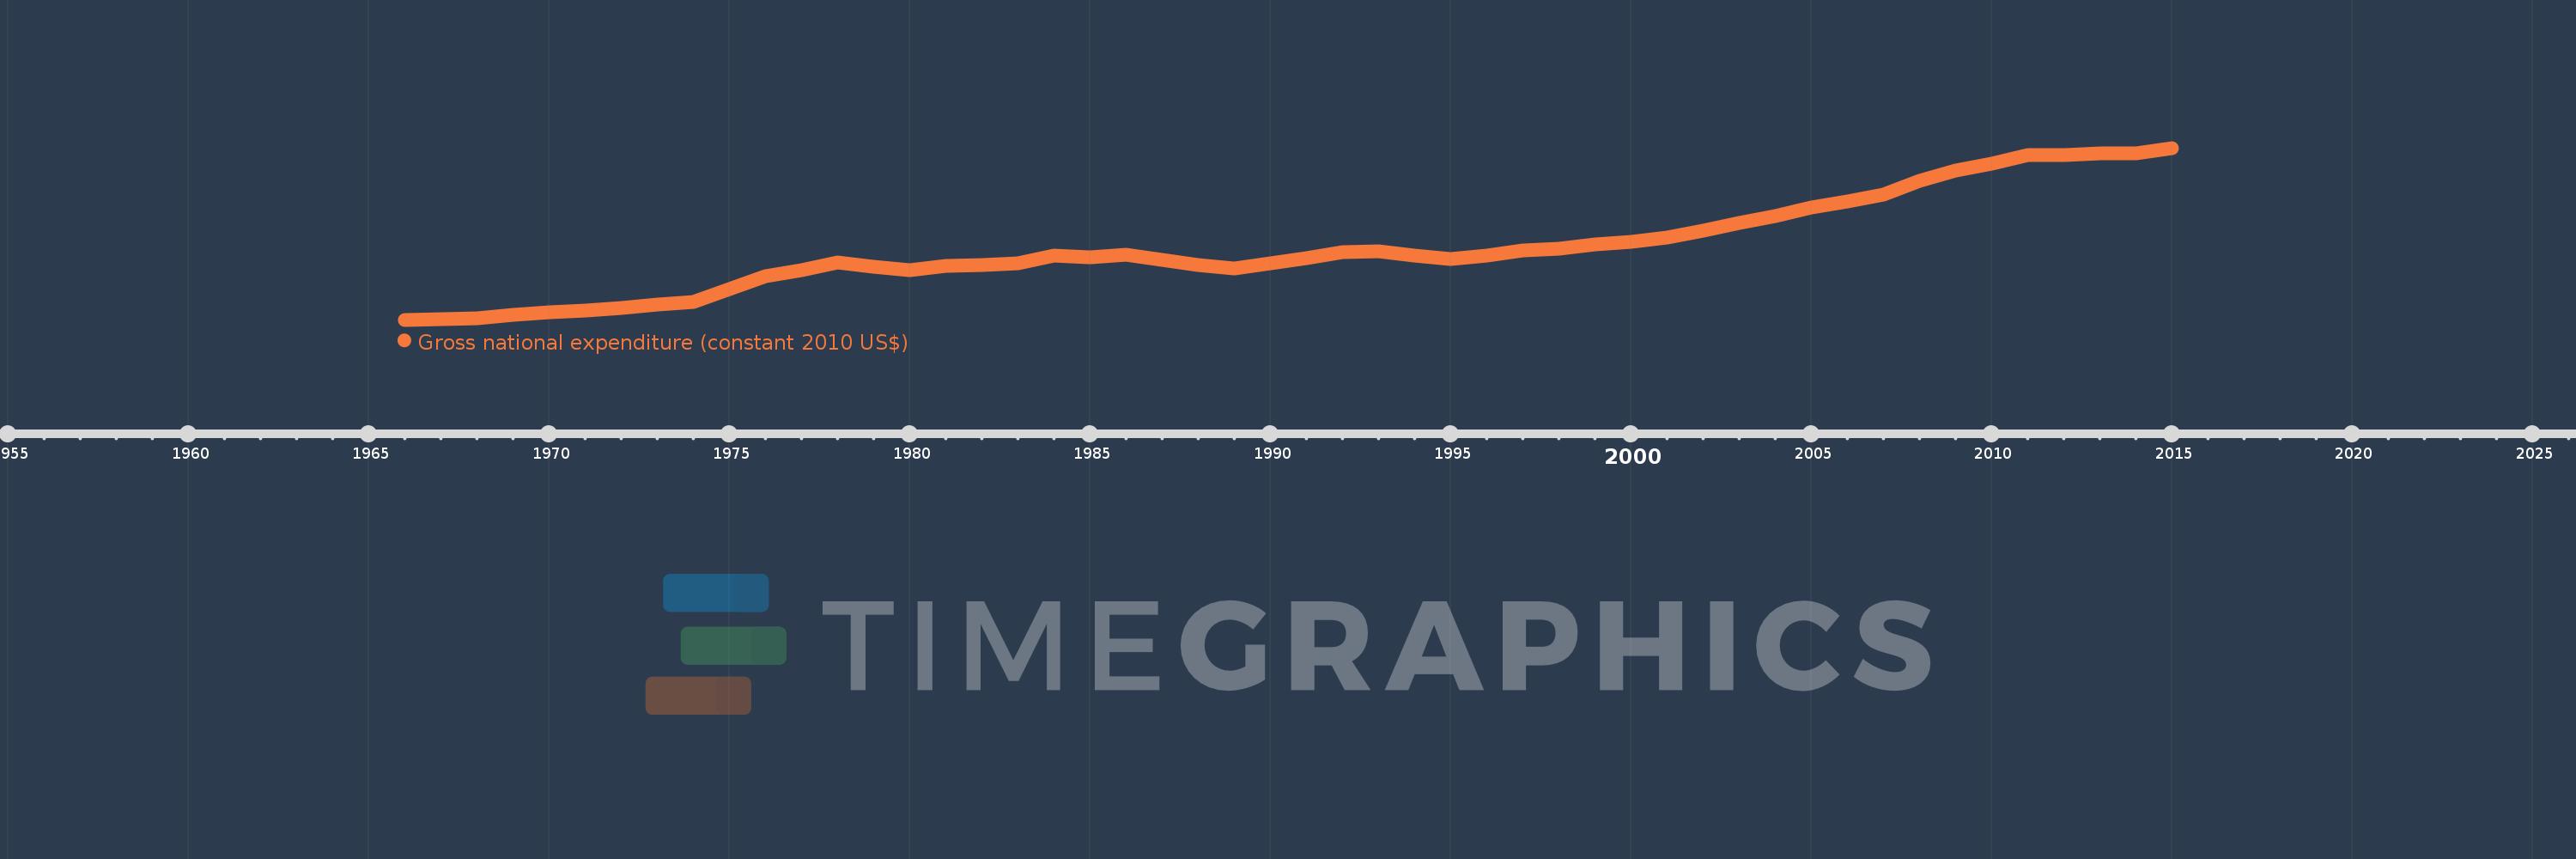
Gross national expenditure (constant 2010 US$)
2015,2014,2013,2012,2011,2010,2009,2008,2007,2006,2005,2004,2003,2002,2001,2000,1999,1998,1997,1996,1995,1994,1993,1992,1991,1990,1989,1988,1987,1986,1985,1984,1983,1982,1981,1980,1979,1978,1977,1976,1975,1974,1973,1972,1971,1970,1969,1968,1967,1966
This statistics in other country:
AfghanistanAlbaniaAlgeriaAngolaAntigua and BarbudaArab WorldArgentinaArmeniaArubaAustraliaAustriaAzerbaijanBahamas, TheBahrainBangladeshBarbadosBelarusBelgiumBelizeBeninBermudaBhutanBoliviaBosnia and HerzegovinaBotswanaBrazilBrunei DarussalamBulgariaBurkina FasoBurundiCabo VerdeCambodiaCameroonCanadaCaribbean small statesCentral African RepublicCentral Europe and the BalticsChadChileChinaColombiaComorosCongo, Dem. Rep.Congo, Rep.Costa RicaCote d'IvoireCroatiaCubaCyprusCzech RepublicDenmarkDominicaDominican RepublicEarly-demographic dividendEast Asia & PacificEast Asia & Pacific (excluding high income)East Asia & Pacific (IDA & IBRD countries)EcuadorEgypt, Arab Rep.El SalvadorEquatorial GuineaEritreaEstoniaEuro areaEurope & Central AsiaEurope & Central Asia (excluding high income)Europe & Central Asia (IDA & IBRD countries)European UnionFaroe IslandsFijiFinlandFragile and conflict affected situationsFranceGabonGambia, TheGeorgiaGermanyGhanaGreeceGrenadaGuatemalaGuineaGuinea-BissauGuyanaHaitiHeavily indebted poor countries (HIPC)High incomeHondurasHong Kong SAR, ChinaHungaryIBRD onlyIcelandIDA & IBRD totalIDA blendIDA onlyIDA totalIndiaIndonesiaIran, Islamic Rep.IraqIrelandIsraelItalyJamaicaJapanJordanKazakhstanKenyaKiribatiKorea, Rep.KosovoKuwaitKyrgyz RepublicLao PDRLate-demographic dividendLatin America & Caribbean Latin America & Caribbean (excluding high income)Latin America & the Caribbean (IDA & IBRD countries)LatviaLeast developed countries: UN classificationLebanonLiberiaLibyaLithuaniaLow & middle incomeLow incomeLower middle incomeLuxembourgMacao SAR, ChinaMacedonia, FYRMadagascarMalawiMalaysiaMaldivesMaliMaltaMauritaniaMauritiusMexicoMiddle East & North AfricaMiddle East & North Africa (excluding high income)Middle East & North Africa (IDA & IBRD countries)Middle incomeMoldovaMongoliaMontenegroMoroccoMozambiqueMyanmarNamibiaNepalNetherlandsNew ZealandNicaraguaNigerNigeriaNorth AmericaNorwayOECD membersOmanOther small statesPacific island small statesPakistanPalauPanamaParaguayPeruPhilippinesPolandPortugalPost-demographic dividendPre-demographic dividendPuerto RicoQatarRomaniaRussian FederationRwandaSamoaSaudi ArabiaSenegalSerbiaSeychellesSierra LeoneSingaporeSlovak RepublicSloveniaSmall statesSolomon IslandsSouth AfricaSouth AsiaSouth Asia (IDA & IBRD)South SudanSpainSri LankaSt. Kitts and NevisSt. LuciaSt. Vincent and the GrenadinesSub-Saharan Africa Sub-Saharan Africa (excluding high income)Sub-Saharan Africa (IDA & IBRD countries)SudanSurinameSwazilandSwedenSwitzerlandTajikistanTanzaniaThailandTimor-LesteTogoTongaTrinidad and TobagoTunisiaTurkeyTurkmenistanUgandaUkraineUnited Arab EmiratesUnited KingdomUnited StatesUpper middle incomeUruguayUzbekistanVanuatuVenezuela, RBVietnamWest Bank and GazaWorldYemen, Rep.ZambiaZimbabwe Timeline:
This timeline shows a graph from 1966 to 2015 of Middle East & North Africa (IDA & IBRD countries). No data until 1965. Number of actual observations by date: 50.
Source name:
World Development Indicators
Source organization:
World Bank national accounts data, and OECD National Accounts data files.
Categories, topics:
Economy & Growth
Last updated:
apr 23, 2017
Indicators value changes by year
Minimum:
152.164 bln
jan 1, 1966
Maximum:
1.385 trl
jan 1, 2015
At the date of observation
Value
Absolute change
Change from previous value
jan 1, 1966
152.164 bln
+152.164 bln
0.0%
jan 1, 1967
155.163 bln
+2.999 bln
1.97%
jan 1, 1968
165.711 bln
+10.548 bln
6.8%
jan 1, 1969
184.384 bln
+18.674 bln
11.27%
jan 1, 1970
202.753 bln
+18.368 bln
9.96%
jan 1, 1971
221.18 bln
+18.427 bln
9.09%
jan 1, 1972
236.399 bln
+15.219 bln
6.88%
jan 1, 1973
262.876 bln
+26.478 bln
11.2%
jan 1, 1974
281.173 bln
+18.296 bln
6.96%
jan 1, 1975
371.349 bln
+90.176 bln
32.07%
jan 1, 1976
463.004 bln
+91.655 bln
24.68%
jan 1, 1977
510.749 bln
+47.745 bln
10.31%
jan 1, 1978
560.82 bln
+50.071 bln
9.8%
jan 1, 1979
530.115 bln
-30.705 bln
-5.47%
jan 1, 1980
508.356 bln
-21.76 bln
-4.1%
jan 1, 1981
537.527 bln
+29.171 bln
5.74%
jan 1, 1982
542.687 bln
+5.16 bln
0.96%
jan 1, 1983
560.084 bln
+17.397 bln
3.21%
jan 1, 1984
612.934 bln
+52.851 bln
9.44%
jan 1, 1985
597.292 bln
-15.642 bln
-2.55%
jan 1, 1986
617.727 bln
+20.435 bln
3.42%
jan 1, 1987
580.156 bln
-37.571 bln
-6.08%
jan 1, 1988
547.453 bln
-32.704 bln
-5.64%
jan 1, 1989
522.718 bln
-24.735 bln
-4.52%
jan 1, 1990
555.709 bln
+32.992 bln
6.31%
jan 1, 1991
594.757 bln
+39.047 bln
7.03%
jan 1, 1992
635.194 bln
+40.437 bln
6.8%
jan 1, 1993
643.566 bln
+8.372 bln
1.32%
jan 1, 1994
611.343 bln
-32.224 bln
-5.01%
jan 1, 1995
586.032 bln
-25.311 bln
-4.14%
jan 1, 1996
613.696 bln
+27.664 bln
4.72%
jan 1, 1997
650.127 bln
+36.43 bln
5.94%
jan 1, 1998
664.02 bln
+13.894 bln
2.14%
jan 1, 1999
694.469 bln
+30.449 bln
4.59%
jan 1, 2000
711.516 bln
+17.047 bln
2.45%
jan 1, 2001
742.974 bln
+31.458 bln
4.42%
jan 1, 2002
788.531 bln
+45.556 bln
6.13%
jan 1, 2003
843.688 bln
+55.157 bln
6.99%
jan 1, 2004
895.703 bln
+52.015 bln
6.17%
jan 1, 2005
956.746 bln
+61.042 bln
6.82%
jan 1, 2006
1.002 trl
+45.285 bln
4.73%
jan 1, 2007
1.047 trl
+45.102 bln
4.5%
jan 1, 2008
1.148 trl
+101.175 bln
9.66%
jan 1, 2009
1.224 trl
+75.697 bln
6.59%
jan 1, 2010
1.272 trl
+48.071 bln
3.93%
jan 1, 2011
1.333 trl
+61.243 bln
4.81%
jan 1, 2012
1.332 trl
-916.208 mln
-0.07%
jan 1, 2013
1.344 trl
+12.001 bln
0.9%
jan 1, 2014
1.347 trl
+2.915 bln
0.22%
jan 1, 2015
1.385 trl
+37.366 bln
2.77%
Ranking of countries by current statistics by years


Comments: