29
/
en
AIzaSyAYiBZKx7MnpbEhh9jyipgxe19OcubqV5w
April 1, 2024
197621
Moldova
MDA
true
2
1
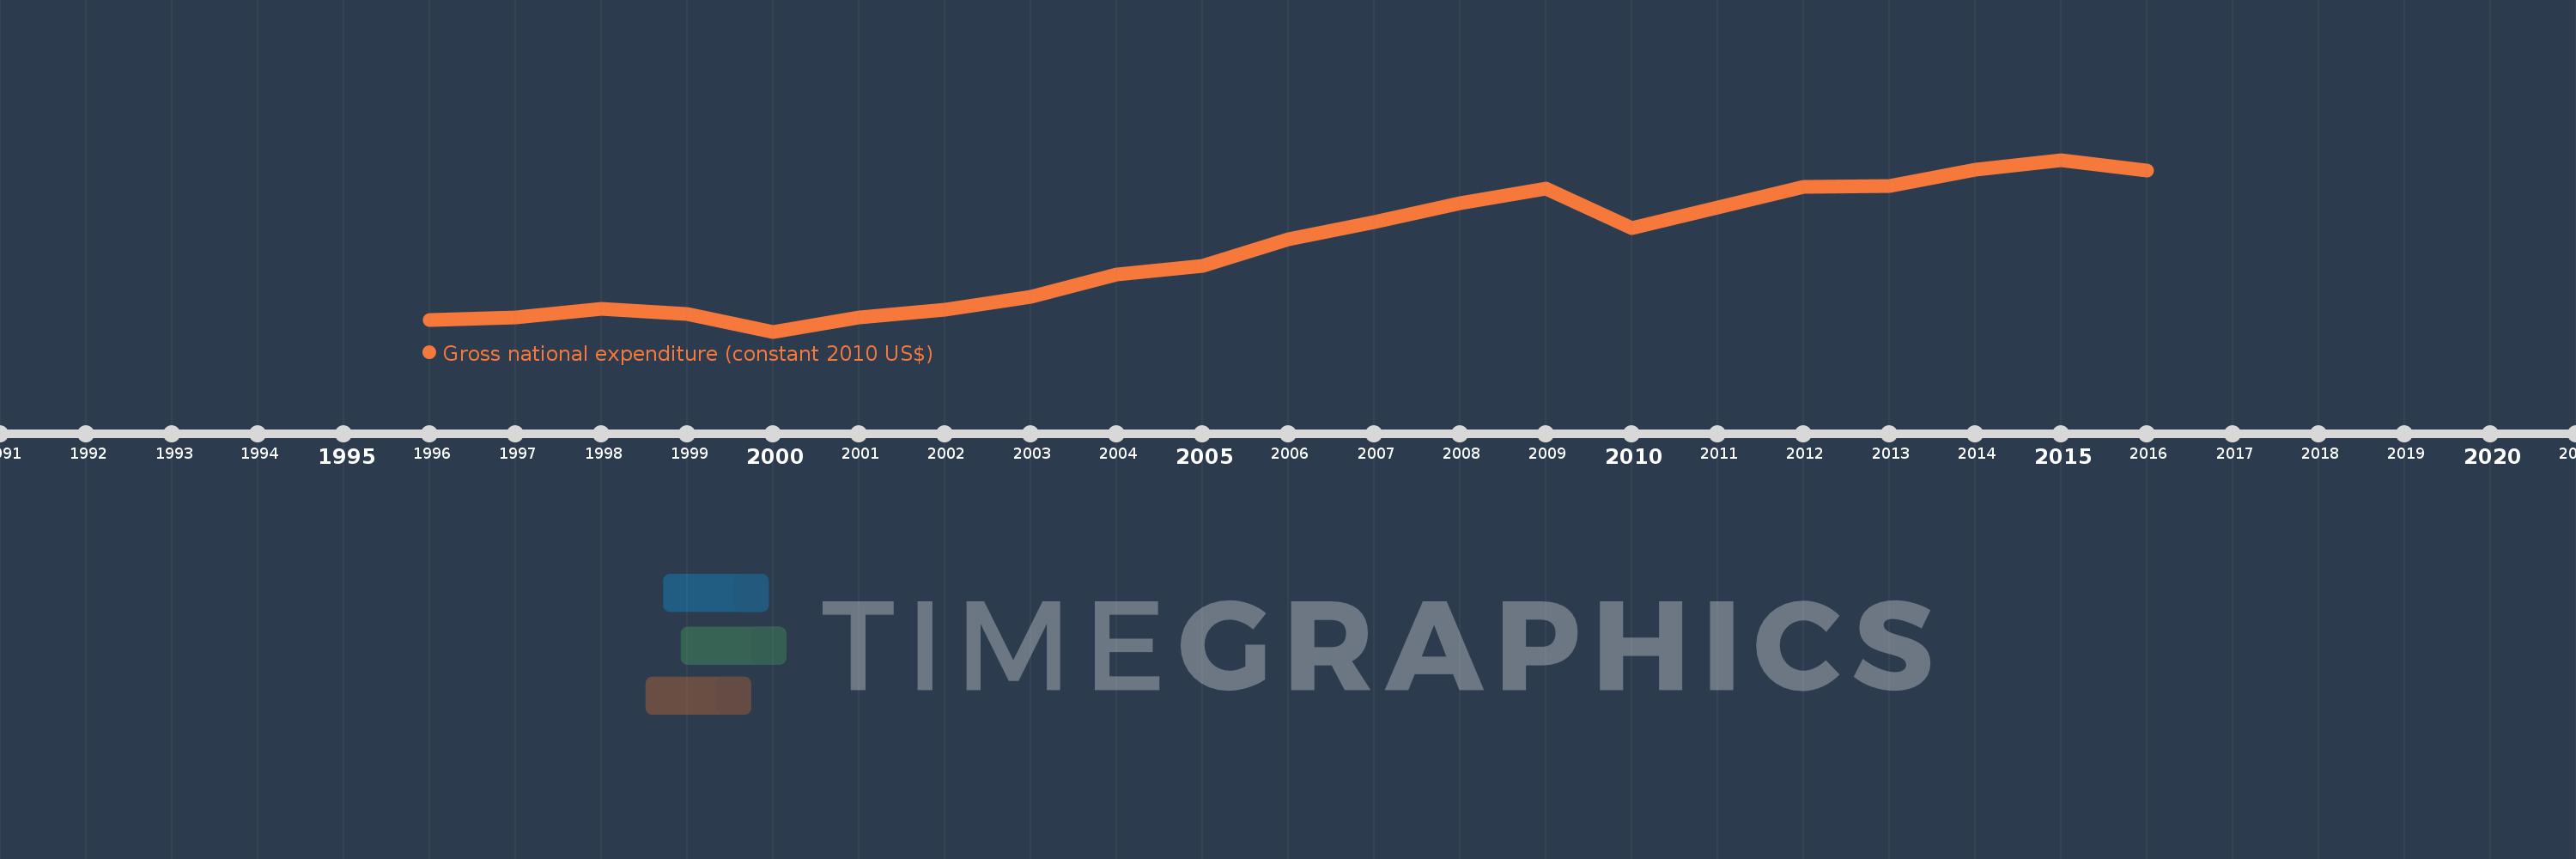
Gross national expenditure (constant 2010 US$)
2016,2015,2014,2013,2012,2011,2010,2009,2008,2007,2006,2005,2004,2003,2002,2001,2000,1999,1998,1997,1996
This statistics in other country:
AfghanistanAlbaniaAlgeriaAngolaAntigua and BarbudaArab WorldArgentinaArmeniaArubaAustraliaAustriaAzerbaijanBahamas, TheBahrainBangladeshBarbadosBelarusBelgiumBelizeBeninBermudaBhutanBoliviaBosnia and HerzegovinaBotswanaBrazilBrunei DarussalamBulgariaBurkina FasoBurundiCabo VerdeCambodiaCameroonCanadaCaribbean small statesCentral African RepublicCentral Europe and the BalticsChadChileChinaColombiaComorosCongo, Dem. Rep.Congo, Rep.Costa RicaCote d'IvoireCroatiaCubaCyprusCzech RepublicDenmarkDominicaDominican RepublicEarly-demographic dividendEast Asia & PacificEast Asia & Pacific (excluding high income)East Asia & Pacific (IDA & IBRD countries)EcuadorEgypt, Arab Rep.El SalvadorEquatorial GuineaEritreaEstoniaEuro areaEurope & Central AsiaEurope & Central Asia (excluding high income)Europe & Central Asia (IDA & IBRD countries)European UnionFaroe IslandsFijiFinlandFragile and conflict affected situationsFranceGabonGambia, TheGeorgiaGermanyGhanaGreeceGrenadaGuatemalaGuineaGuinea-BissauGuyanaHaitiHeavily indebted poor countries (HIPC)High incomeHondurasHong Kong SAR, ChinaHungaryIBRD onlyIcelandIDA & IBRD totalIDA blendIDA onlyIDA totalIndiaIndonesiaIran, Islamic Rep.IraqIrelandIsraelItalyJamaicaJapanJordanKazakhstanKenyaKiribatiKorea, Rep.KosovoKuwaitKyrgyz RepublicLao PDRLate-demographic dividendLatin America & Caribbean Latin America & Caribbean (excluding high income)Latin America & the Caribbean (IDA & IBRD countries)LatviaLeast developed countries: UN classificationLebanonLiberiaLibyaLithuaniaLow & middle incomeLow incomeLower middle incomeLuxembourgMacao SAR, ChinaMacedonia, FYRMadagascarMalawiMalaysiaMaldivesMaliMaltaMauritaniaMauritiusMexicoMiddle East & North AfricaMiddle East & North Africa (excluding high income)Middle East & North Africa (IDA & IBRD countries)Middle incomeMoldovaMongoliaMontenegroMoroccoMozambiqueMyanmarNamibiaNepalNetherlandsNew ZealandNicaraguaNigerNigeriaNorth AmericaNorwayOECD membersOmanOther small statesPacific island small statesPakistanPalauPanamaParaguayPeruPhilippinesPolandPortugalPost-demographic dividendPre-demographic dividendPuerto RicoQatarRomaniaRussian FederationRwandaSamoaSaudi ArabiaSenegalSerbiaSeychellesSierra LeoneSingaporeSlovak RepublicSloveniaSmall statesSolomon IslandsSouth AfricaSouth AsiaSouth Asia (IDA & IBRD)South SudanSpainSri LankaSt. Kitts and NevisSt. LuciaSt. Vincent and the GrenadinesSub-Saharan Africa Sub-Saharan Africa (excluding high income)Sub-Saharan Africa (IDA & IBRD countries)SudanSurinameSwazilandSwedenSwitzerlandTajikistanTanzaniaThailandTimor-LesteTogoTongaTrinidad and TobagoTunisiaTurkeyTurkmenistanUgandaUkraineUnited Arab EmiratesUnited KingdomUnited StatesUpper middle incomeUruguayUzbekistanVanuatuVenezuela, RBVietnamWest Bank and GazaWorldYemen, Rep.ZambiaZimbabwe Timeline:
This timeline shows a graph from 1996 to 2016 of Moldova. No data until 1995. Number of actual observations by date: 21.
Source name:
World Development Indicators
Source organization:
World Bank national accounts data, and OECD National Accounts data files.
Categories, topics:
Economy & Growth
Last updated:
apr 23, 2017
Indicators value changes by year
Minimum:
4.057 bln
jan 1, 2000
Maximum:
9.65 bln
jan 1, 2015
At the date of observation
Value
Absolute change
Change from previous value
jan 1, 1996
4.429 bln
+4.429 bln
0.0%
jan 1, 1997
4.528 bln
+98.116 mln
2.22%
jan 1, 1998
4.801 bln
+273.744 mln
6.05%
jan 1, 1999
4.63 bln
-171.742 mln
-3.58%
jan 1, 2000
4.057 bln
-572.33 mln
-12.36%
jan 1, 2001
4.519 bln
+462.077 mln
11.39%
jan 1, 2002
4.778 bln
+258.964 mln
5.73%
jan 1, 2003
5.198 bln
+419.627 mln
8.78%
jan 1, 2004
5.923 bln
+725.547 mln
13.96%
jan 1, 2005
6.185 bln
+261.716 mln
4.42%
jan 1, 2006
7.05 bln
+864.957 mln
13.98%
jan 1, 2007
7.636 bln
+586.032 mln
8.31%
jan 1, 2008
8.229 bln
+592.414 mln
7.76%
jan 1, 2009
8.716 bln
+487.684 mln
5.93%
jan 1, 2010
7.415 bln
-1.301 bln
-14.93%
jan 1, 2011
8.097 bln
+681.685 mln
9.19%
jan 1, 2012
8.767 bln
+669.828 mln
8.27%
jan 1, 2013
8.794 bln
+27.388 mln
0.31%
jan 1, 2014
9.335 bln
+541.514 mln
6.16%
jan 1, 2015
9.65 bln
+314.598 mln
3.37%
jan 1, 2016
9.288 bln
-362.219 mln
-3.75%
Ranking of countries by current statistics by years


Comments: