29
/
en
AIzaSyAYiBZKx7MnpbEhh9jyipgxe19OcubqV5w
April 1, 2024
43478
Latin America & the Caribbean (IDA & IBRD countries)
TLA
false
2
1
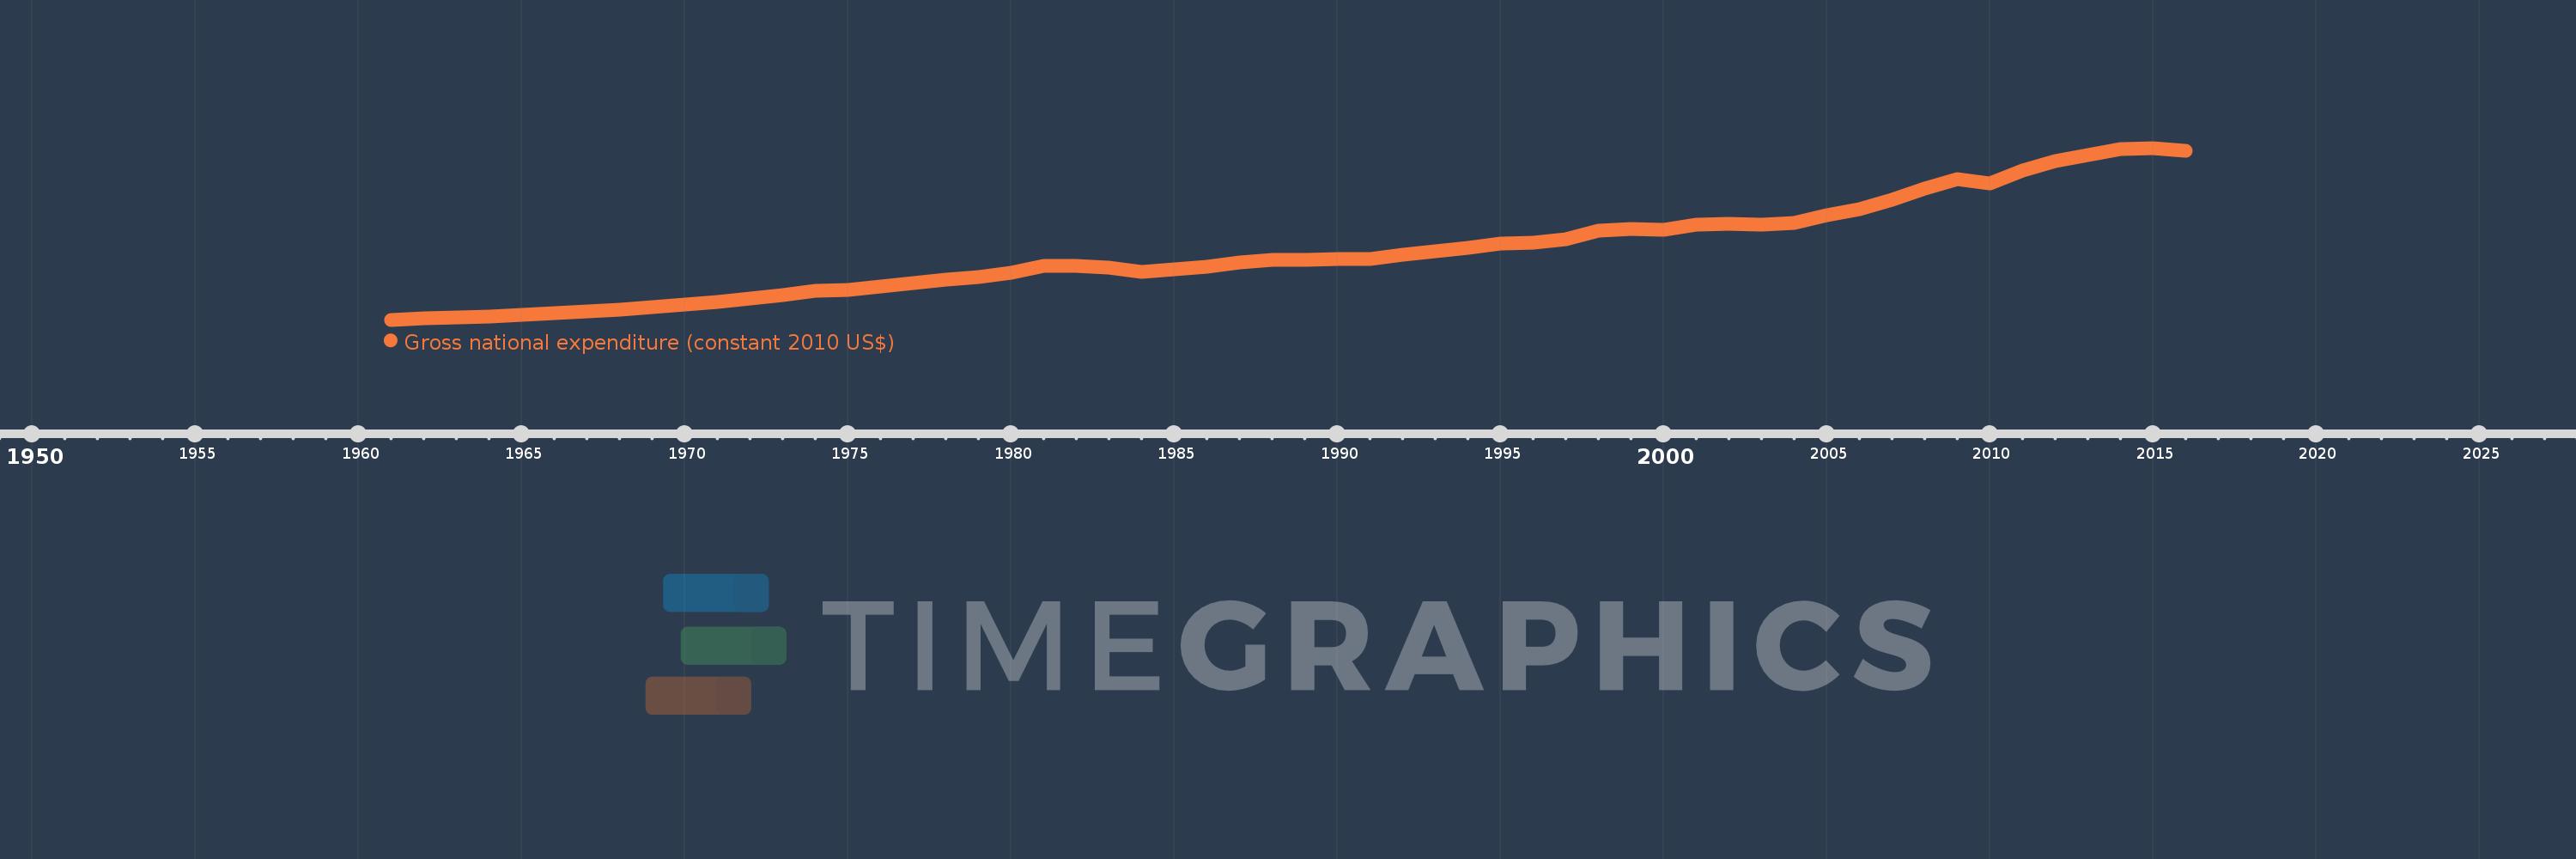
Gross national expenditure (constant 2010 US$)
2016,2015,2014,2013,2012,2011,2010,2009,2008,2007,2006,2005,2004,2003,2002,2001,2000,1999,1998,1997,1996,1995,1994,1993,1992,1991,1990,1989,1988,1987,1986,1985,1984,1983,1982,1981,1980,1979,1978,1977,1976,1975,1974,1973,1972,1971,1970,1969,1968,1967,1966,1965,1964,1963,1962,1961
This statistics in other country:
AfghanistanAlbaniaAlgeriaAngolaAntigua and BarbudaArab WorldArgentinaArmeniaArubaAustraliaAustriaAzerbaijanBahamas, TheBahrainBangladeshBarbadosBelarusBelgiumBelizeBeninBermudaBhutanBoliviaBosnia and HerzegovinaBotswanaBrazilBrunei DarussalamBulgariaBurkina FasoBurundiCabo VerdeCambodiaCameroonCanadaCaribbean small statesCentral African RepublicCentral Europe and the BalticsChadChileChinaColombiaComorosCongo, Dem. Rep.Congo, Rep.Costa RicaCote d'IvoireCroatiaCubaCyprusCzech RepublicDenmarkDominicaDominican RepublicEarly-demographic dividendEast Asia & PacificEast Asia & Pacific (excluding high income)East Asia & Pacific (IDA & IBRD countries)EcuadorEgypt, Arab Rep.El SalvadorEquatorial GuineaEritreaEstoniaEuro areaEurope & Central AsiaEurope & Central Asia (excluding high income)Europe & Central Asia (IDA & IBRD countries)European UnionFaroe IslandsFijiFinlandFragile and conflict affected situationsFranceGabonGambia, TheGeorgiaGermanyGhanaGreeceGrenadaGuatemalaGuineaGuinea-BissauGuyanaHaitiHeavily indebted poor countries (HIPC)High incomeHondurasHong Kong SAR, ChinaHungaryIBRD onlyIcelandIDA & IBRD totalIDA blendIDA onlyIDA totalIndiaIndonesiaIran, Islamic Rep.IraqIrelandIsraelItalyJamaicaJapanJordanKazakhstanKenyaKiribatiKorea, Rep.KosovoKuwaitKyrgyz RepublicLao PDRLate-demographic dividendLatin America & Caribbean Latin America & Caribbean (excluding high income)Latin America & the Caribbean (IDA & IBRD countries)LatviaLeast developed countries: UN classificationLebanonLiberiaLibyaLithuaniaLow & middle incomeLow incomeLower middle incomeLuxembourgMacao SAR, ChinaMacedonia, FYRMadagascarMalawiMalaysiaMaldivesMaliMaltaMauritaniaMauritiusMexicoMiddle East & North AfricaMiddle East & North Africa (excluding high income)Middle East & North Africa (IDA & IBRD countries)Middle incomeMoldovaMongoliaMontenegroMoroccoMozambiqueMyanmarNamibiaNepalNetherlandsNew ZealandNicaraguaNigerNigeriaNorth AmericaNorwayOECD membersOmanOther small statesPacific island small statesPakistanPalauPanamaParaguayPeruPhilippinesPolandPortugalPost-demographic dividendPre-demographic dividendPuerto RicoQatarRomaniaRussian FederationRwandaSamoaSaudi ArabiaSenegalSerbiaSeychellesSierra LeoneSingaporeSlovak RepublicSloveniaSmall statesSolomon IslandsSouth AfricaSouth AsiaSouth Asia (IDA & IBRD)South SudanSpainSri LankaSt. Kitts and NevisSt. LuciaSt. Vincent and the GrenadinesSub-Saharan Africa Sub-Saharan Africa (excluding high income)Sub-Saharan Africa (IDA & IBRD countries)SudanSurinameSwazilandSwedenSwitzerlandTajikistanTanzaniaThailandTimor-LesteTogoTongaTrinidad and TobagoTunisiaTurkeyTurkmenistanUgandaUkraineUnited Arab EmiratesUnited KingdomUnited StatesUpper middle incomeUruguayUzbekistanVanuatuVenezuela, RBVietnamWest Bank and GazaWorldYemen, Rep.ZambiaZimbabwe Timeline:
This timeline shows a graph from 1961 to 2016 of Latin America & the Caribbean (IDA & IBRD countries). No data until 1960. Number of actual observations by date: 56.
Source name:
World Development Indicators
Source organization:
World Bank national accounts data, and OECD National Accounts data files.
Categories, topics:
Economy & Growth
Last updated:
apr 23, 2017
Indicators value changes by year
Minimum:
721.061 bln
jan 1, 1961
Maximum:
5.807 trl
jan 1, 2015
At the date of observation
Value
Absolute change
Change from previous value
jan 1, 1961
721.061 bln
+721.061 bln
0.0%
jan 1, 1962
771.168 bln
+50.107 bln
6.95%
jan 1, 1963
801.817 bln
+30.649 bln
3.97%
jan 1, 1964
817.31 bln
+15.493 bln
1.93%
jan 1, 1965
877.606 bln
+60.297 bln
7.38%
jan 1, 1966
920.841 bln
+43.234 bln
4.93%
jan 1, 1967
963.937 bln
+43.097 bln
4.68%
jan 1, 1968
1.008 trl
+44.15 bln
4.58%
jan 1, 1969
1.089 trl
+81.37 bln
8.07%
jan 1, 1970
1.165 trl
+75.51 bln
6.93%
jan 1, 1971
1.244 trl
+79.498 bln
6.82%
jan 1, 1972
1.343 trl
+98.463 bln
7.91%
jan 1, 1973
1.447 trl
+104.101 bln
7.75%
jan 1, 1974
1.584 trl
+137.109 bln
9.48%
jan 1, 1975
1.609 trl
+24.698 bln
1.56%
jan 1, 1976
1.709 trl
+100.191 bln
6.23%
jan 1, 1977
1.819 trl
+109.721 bln
6.42%
jan 1, 1978
1.916 trl
+96.786 bln
5.32%
jan 1, 1979
1.992 trl
+76.392 bln
3.99%
jan 1, 1980
2.121 trl
+129.517 bln
6.5%
jan 1, 1981
2.307 trl
+185.816 bln
8.76%
jan 1, 1982
2.312 trl
+4.416 bln
0.19%
jan 1, 1983
2.258 trl
-53.702 bln
-2.32%
jan 1, 1984
2.143 trl
-114.547 bln
-5.07%
jan 1, 1985
2.211 trl
+67.859 bln
3.17%
jan 1, 1986
2.297 trl
+85.803 bln
3.88%
jan 1, 1987
2.412 trl
+115.368 bln
5.02%
jan 1, 1988
2.496 trl
+83.821 bln
3.47%
jan 1, 1989
2.505 trl
+8.23 bln
0.33%
jan 1, 1990
2.521 trl
+16.993 bln
0.68%
jan 1, 1991
2.521 trl
-30.121 mln
0.0%
jan 1, 1992
2.647 trl
+125.512 bln
4.98%
jan 1, 1993
2.76 trl
+113.365 bln
4.28%
jan 1, 1994
2.842 trl
+81.216 bln
2.94%
jan 1, 1995
2.982 trl
+140.777 bln
4.95%
jan 1, 1996
3.002 trl
+20.086 bln
0.67%
jan 1, 1997
3.101 trl
+98.276 bln
3.27%
jan 1, 1998
3.348 trl
+247.024 bln
7.97%
jan 1, 1999
3.419 trl
+71.494 bln
2.14%
jan 1, 2000
3.386 trl
-33.282 bln
-0.97%
jan 1, 2001
3.529 trl
+143.258 bln
4.23%
jan 1, 2002
3.561 trl
+31.333 bln
0.89%
jan 1, 2003
3.524 trl
-36.949 bln
-1.04%
jan 1, 2004
3.579 trl
+55.759 bln
1.58%
jan 1, 2005
3.804 trl
+224.52 bln
6.27%
jan 1, 2006
3.993 trl
+188.909 bln
4.97%
jan 1, 2007
4.268 trl
+275.661 bln
6.9%
jan 1, 2008
4.604 trl
+336.003 bln
7.87%
jan 1, 2009
4.876 trl
+271.305 bln
5.89%
jan 1, 2010
4.744 trl
-131.402 bln
-2.7%
jan 1, 2011
5.133 trl
+388.866 bln
8.2%
jan 1, 2012
5.418 trl
+284.837 bln
5.55%
jan 1, 2013
5.604 trl
+185.584 bln
3.43%
jan 1, 2014
5.781 trl
+177.591 bln
3.17%
jan 1, 2015
5.807 trl
+25.662 bln
0.44%
jan 1, 2016
5.719 trl
-87.979 bln
-1.52%
Ranking of countries by current statistics by years


Comments: