29
/
en
AIzaSyAYiBZKx7MnpbEhh9jyipgxe19OcubqV5w
April 1, 2024
266910
Trinidad and Tobago
TTO
true
2
1
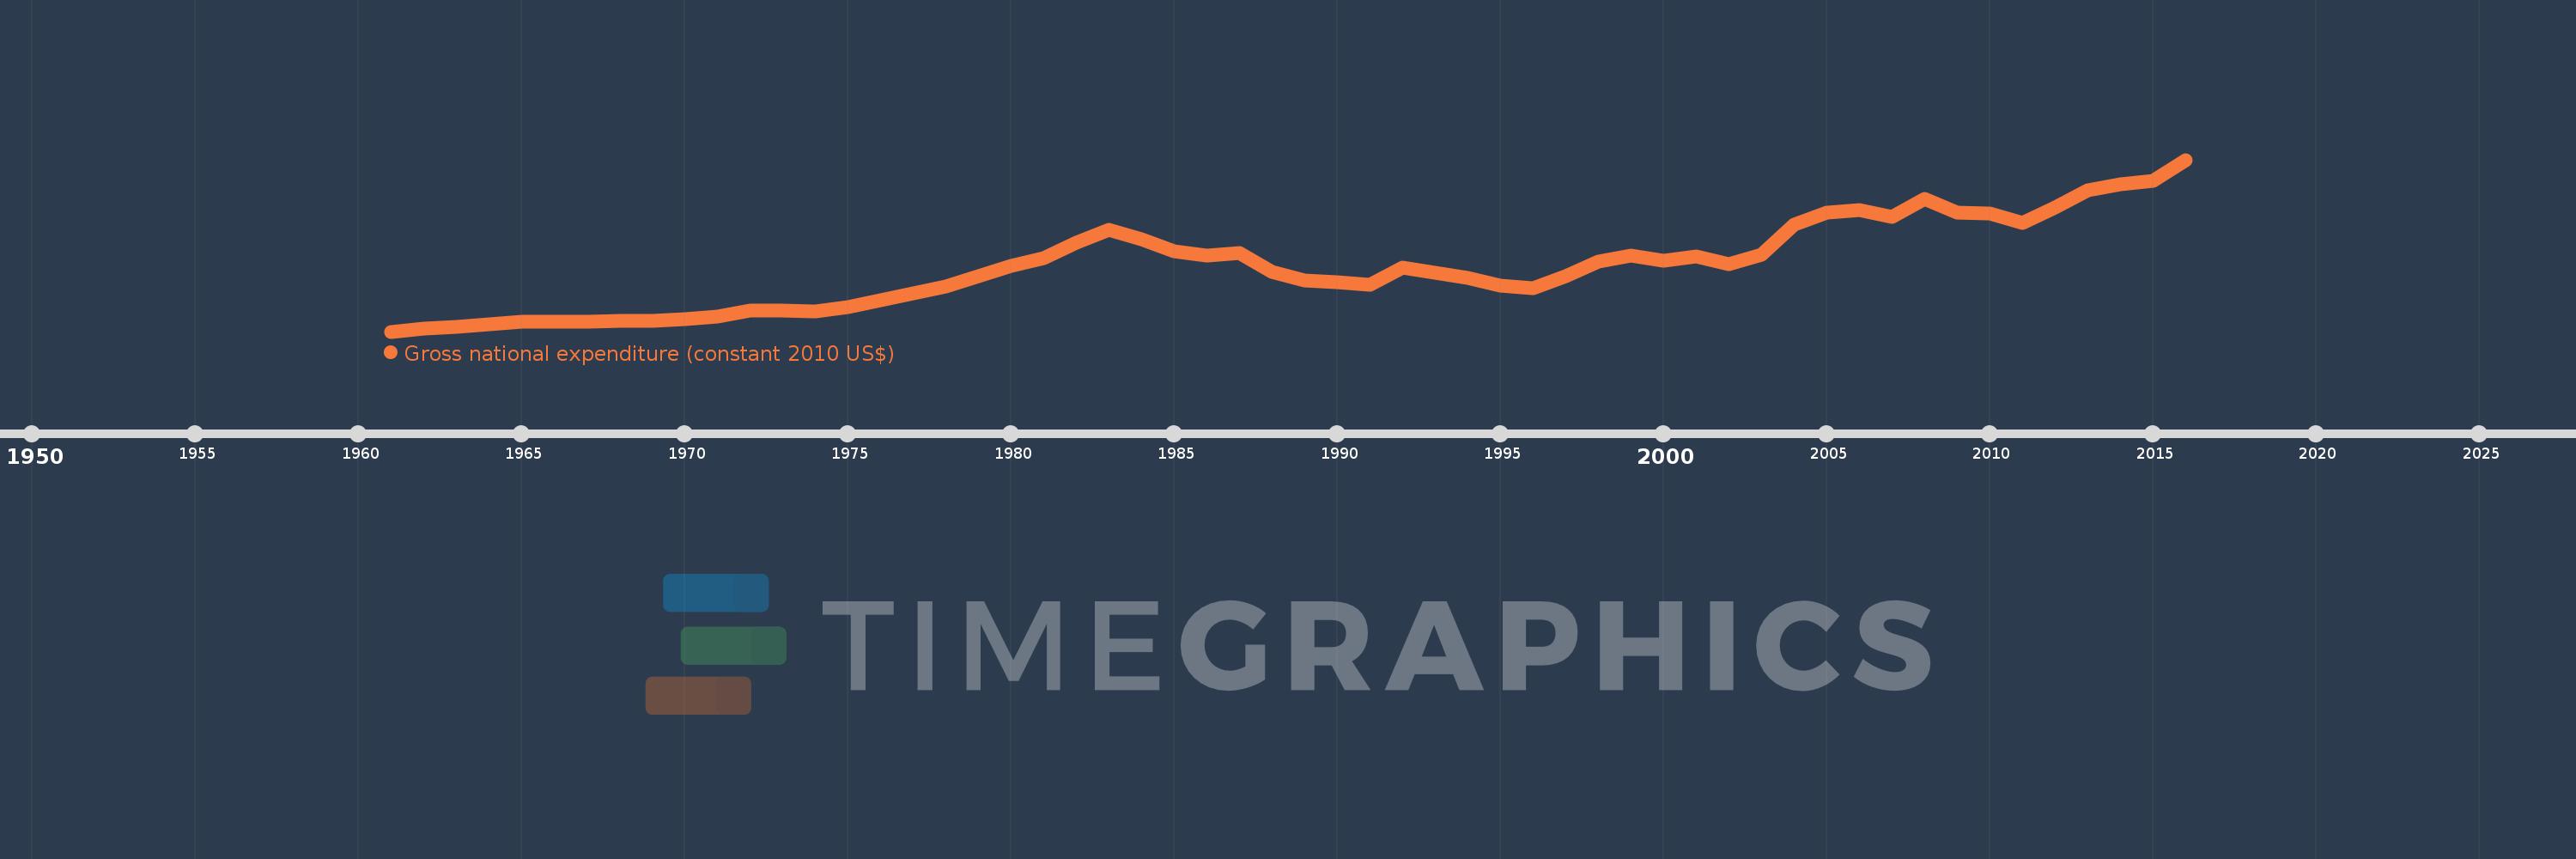
Gross national expenditure (constant 2010 US$)
2016,2015,2014,2013,2012,2011,2010,2009,2008,2007,2006,2005,2004,2003,2002,2001,2000,1999,1998,1997,1996,1995,1994,1993,1992,1991,1990,1989,1988,1987,1986,1985,1984,1983,1982,1981,1980,1979,1978,1977,1976,1975,1974,1973,1972,1971,1970,1969,1968,1967,1966,1965,1964,1963,1962,1961
This statistics in other country:
AfghanistanAlbaniaAlgeriaAngolaAntigua and BarbudaArab WorldArgentinaArmeniaArubaAustraliaAustriaAzerbaijanBahamas, TheBahrainBangladeshBarbadosBelarusBelgiumBelizeBeninBermudaBhutanBoliviaBosnia and HerzegovinaBotswanaBrazilBrunei DarussalamBulgariaBurkina FasoBurundiCabo VerdeCambodiaCameroonCanadaCaribbean small statesCentral African RepublicCentral Europe and the BalticsChadChileChinaColombiaComorosCongo, Dem. Rep.Congo, Rep.Costa RicaCote d'IvoireCroatiaCubaCyprusCzech RepublicDenmarkDominicaDominican RepublicEarly-demographic dividendEast Asia & PacificEast Asia & Pacific (excluding high income)East Asia & Pacific (IDA & IBRD countries)EcuadorEgypt, Arab Rep.El SalvadorEquatorial GuineaEritreaEstoniaEuro areaEurope & Central AsiaEurope & Central Asia (excluding high income)Europe & Central Asia (IDA & IBRD countries)European UnionFaroe IslandsFijiFinlandFragile and conflict affected situationsFranceGabonGambia, TheGeorgiaGermanyGhanaGreeceGrenadaGuatemalaGuineaGuinea-BissauGuyanaHaitiHeavily indebted poor countries (HIPC)High incomeHondurasHong Kong SAR, ChinaHungaryIBRD onlyIcelandIDA & IBRD totalIDA blendIDA onlyIDA totalIndiaIndonesiaIran, Islamic Rep.IraqIrelandIsraelItalyJamaicaJapanJordanKazakhstanKenyaKiribatiKorea, Rep.KosovoKuwaitKyrgyz RepublicLao PDRLate-demographic dividendLatin America & Caribbean Latin America & Caribbean (excluding high income)Latin America & the Caribbean (IDA & IBRD countries)LatviaLeast developed countries: UN classificationLebanonLiberiaLibyaLithuaniaLow & middle incomeLow incomeLower middle incomeLuxembourgMacao SAR, ChinaMacedonia, FYRMadagascarMalawiMalaysiaMaldivesMaliMaltaMauritaniaMauritiusMexicoMiddle East & North AfricaMiddle East & North Africa (excluding high income)Middle East & North Africa (IDA & IBRD countries)Middle incomeMoldovaMongoliaMontenegroMoroccoMozambiqueMyanmarNamibiaNepalNetherlandsNew ZealandNicaraguaNigerNigeriaNorth AmericaNorwayOECD membersOmanOther small statesPacific island small statesPakistanPalauPanamaParaguayPeruPhilippinesPolandPortugalPost-demographic dividendPre-demographic dividendPuerto RicoQatarRomaniaRussian FederationRwandaSamoaSaudi ArabiaSenegalSerbiaSeychellesSierra LeoneSingaporeSlovak RepublicSloveniaSmall statesSolomon IslandsSouth AfricaSouth AsiaSouth Asia (IDA & IBRD)South SudanSpainSri LankaSt. Kitts and NevisSt. LuciaSt. Vincent and the GrenadinesSub-Saharan Africa Sub-Saharan Africa (excluding high income)Sub-Saharan Africa (IDA & IBRD countries)SudanSurinameSwazilandSwedenSwitzerlandTajikistanTanzaniaThailandTimor-LesteTogoTongaTrinidad and TobagoTunisiaTurkeyTurkmenistanUgandaUkraineUnited Arab EmiratesUnited KingdomUnited StatesUpper middle incomeUruguayUzbekistanVanuatuVenezuela, RBVietnamWest Bank and GazaWorldYemen, Rep.ZambiaZimbabwe Timeline:
This timeline shows a graph from 1961 to 2016 of Trinidad and Tobago. No data until 1960. Number of actual observations by date: 56.
Source name:
World Development Indicators
Source organization:
World Bank national accounts data, and OECD National Accounts data files.
Categories, topics:
Economy & Growth
Last updated:
apr 23, 2017
Indicators value changes by year
Minimum:
3.925 bln
jan 1, 1961
Maximum:
24.414 bln
jan 1, 2016
At the date of observation
Value
Absolute change
Change from previous value
jan 1, 1961
3.925 bln
+3.925 bln
0.0%
jan 1, 1962
4.313 bln
+388.059 mln
9.89%
jan 1, 1963
4.471 bln
+158.057 mln
3.66%
jan 1, 1964
4.808 bln
+337.132 mln
7.54%
jan 1, 1965
5.112 bln
+303.54 mln
6.31%
jan 1, 1966
5.144 bln
+32.564 mln
0.64%
jan 1, 1967
5.135 bln
-9.392 mln
-0.18%
jan 1, 1968
5.159 bln
+23.781 mln
0.46%
jan 1, 1969
5.241 bln
+82.078 mln
1.59%
jan 1, 1970
5.437 bln
+196.104 mln
3.74%
jan 1, 1971
5.717 bln
+279.795 mln
5.15%
jan 1, 1972
6.413 bln
+696.782 mln
12.19%
jan 1, 1973
6.45 bln
+36.821 mln
0.57%
jan 1, 1974
6.344 bln
-106.383 mln
-1.65%
jan 1, 1975
6.838 bln
+494.226 mln
7.79%
jan 1, 1976
7.622 bln
+784.293 mln
11.47%
jan 1, 1977
8.436 bln
+814.187 mln
10.68%
jan 1, 1978
9.343 bln
+906.926 mln
10.75%
jan 1, 1979
10.568 bln
+1.224 bln
13.1%
jan 1, 1980
11.752 bln
+1.184 bln
11.2%
jan 1, 1981
12.645 bln
+893.662 mln
7.6%
jan 1, 1982
14.494 bln
+1.848 bln
14.62%
jan 1, 1983
16.058 bln
+1.565 bln
10.8%
jan 1, 1984
14.936 bln
-1.122 bln
-6.99%
jan 1, 1985
13.533 bln
-1.404 bln
-9.4%
jan 1, 1986
12.943 bln
-589.165 mln
-4.35%
jan 1, 1987
13.258 bln
+314.741 mln
2.43%
jan 1, 1988
11.051 bln
-2.207 bln
-16.65%
jan 1, 1989
10.017 bln
-1.033 bln
-9.35%
jan 1, 1990
9.786 bln
-231.284 mln
-2.31%
jan 1, 1991
9.54 bln
-246.364 mln
-2.52%
jan 1, 1992
11.536 bln
+1.996 bln
20.92%
jan 1, 1993
10.928 bln
-607.938 mln
-5.27%
jan 1, 1994
10.282 bln
-645.835 mln
-5.91%
jan 1, 1995
9.4 bln
-882.188 mln
-8.58%
jan 1, 1996
9.14 bln
-259.423 mln
-2.76%
jan 1, 1997
10.562 bln
+1.422 bln
15.56%
jan 1, 1998
12.249 bln
+1.687 bln
15.97%
jan 1, 1999
12.972 bln
+722.533 mln
5.9%
jan 1, 2000
12.393 bln
-578.488 mln
-4.46%
jan 1, 2001
12.896 bln
+502.396 mln
4.05%
jan 1, 2002
11.991 bln
-904.834 mln
-7.02%
jan 1, 2003
13.095 bln
+1.104 bln
9.21%
jan 1, 2004
16.717 bln
+3.621 bln
27.65%
jan 1, 2005
18.139 bln
+1.422 bln
8.51%
jan 1, 2006
18.39 bln
+251.189 mln
1.38%
jan 1, 2007
17.584 bln
-806.603 mln
-4.39%
jan 1, 2008
19.75 bln
+2.167 bln
12.32%
jan 1, 2009
18.106 bln
-1.645 bln
-8.33%
jan 1, 2010
18.013 bln
-92.994 mln
-0.51%
jan 1, 2011
16.935 bln
-1.078 bln
-5.98%
jan 1, 2012
18.773 bln
+1.838 bln
10.86%
jan 1, 2013
20.772 bln
+1.999 bln
10.65%
jan 1, 2014
21.46 bln
+687.761 mln
3.31%
jan 1, 2015
21.885 bln
+425.169 mln
1.98%
jan 1, 2016
24.414 bln
+2.529 bln
11.56%
Ranking of countries by current statistics by years


Comments: