29
/
en
AIzaSyAYiBZKx7MnpbEhh9jyipgxe19OcubqV5w
April 1, 2024
68868
Antigua and Barbuda
ATG
true
2
1
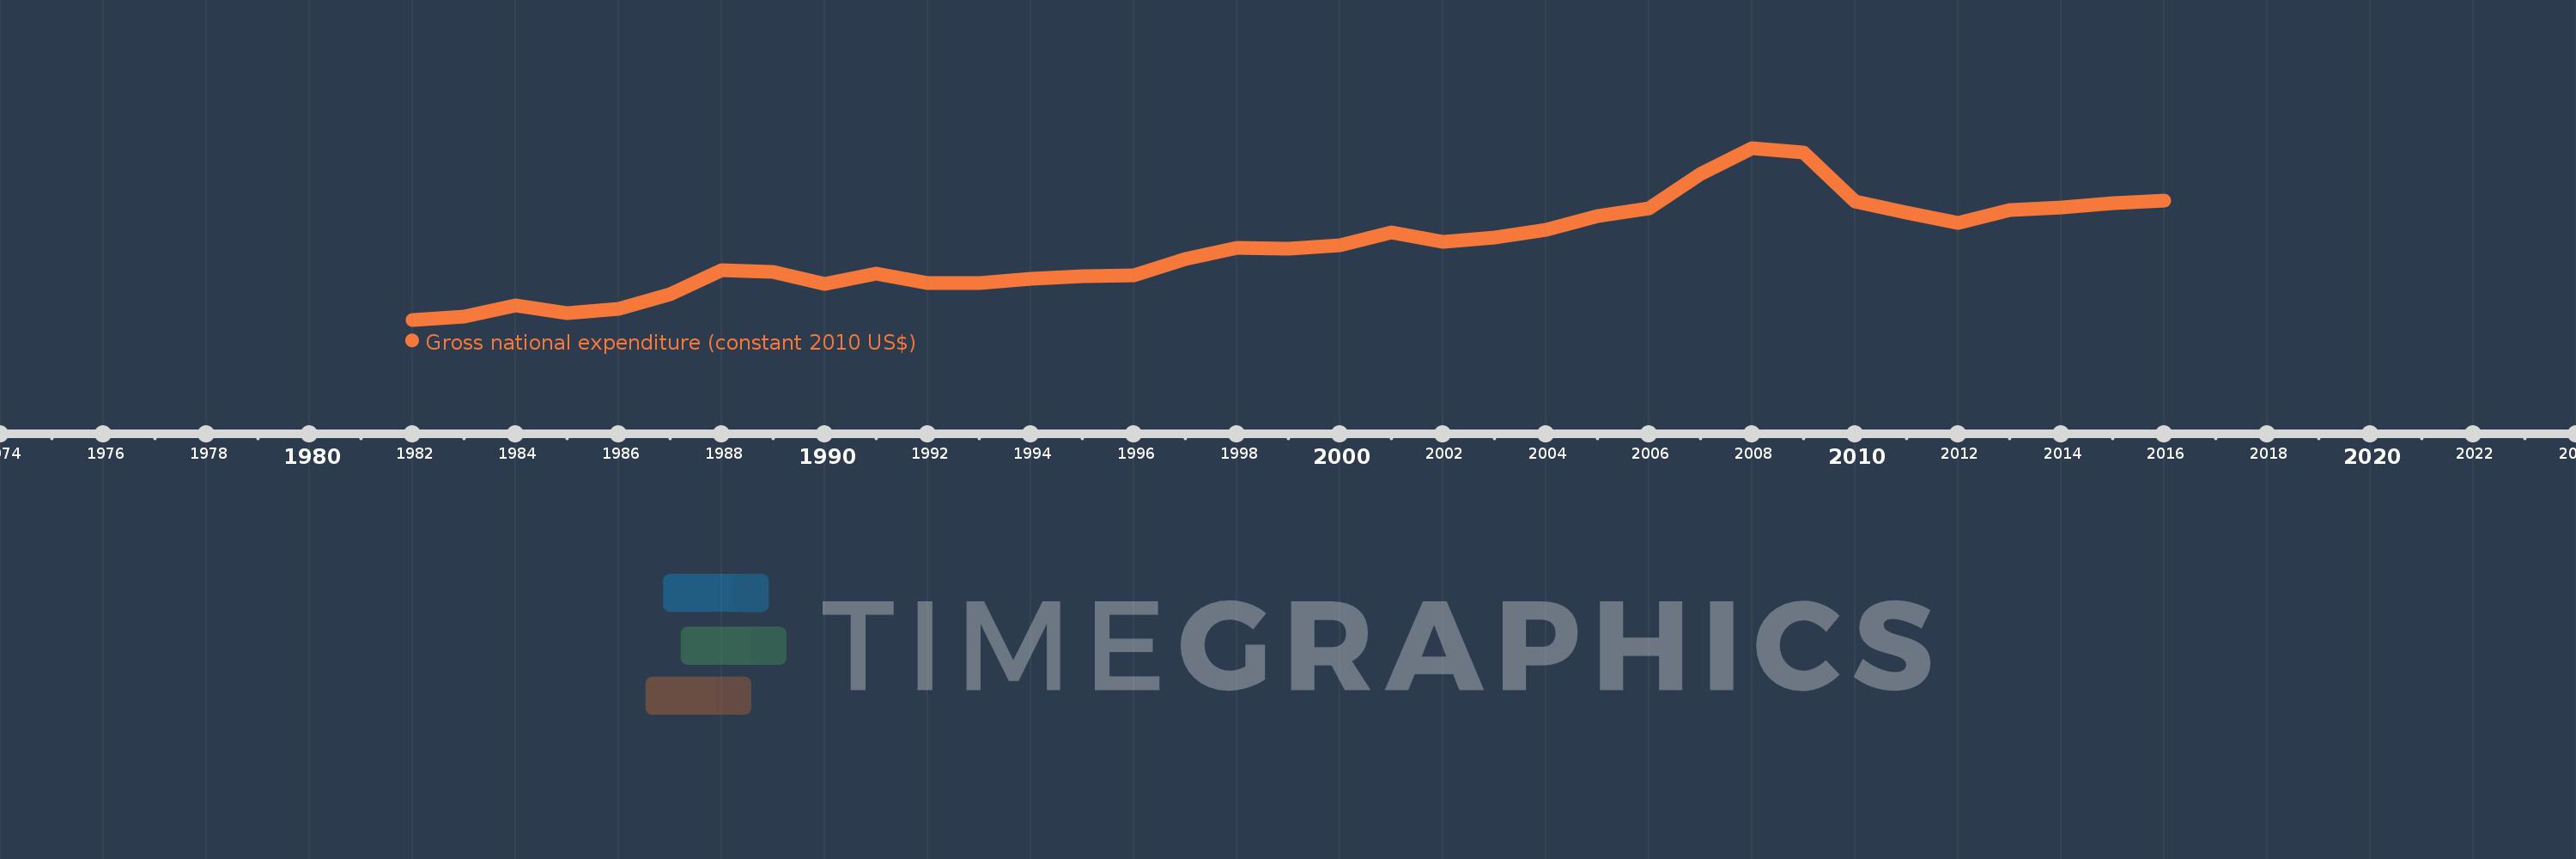
Gross national expenditure (constant 2010 US$)
2016,2015,2014,2013,2012,2011,2010,2009,2008,2007,2006,2005,2004,2003,2002,2001,2000,1999,1998,1997,1996,1995,1994,1993,1992,1991,1990,1989,1988,1987,1986,1985,1984,1983,1982
This statistics in other country:
AfghanistanAlbaniaAlgeriaAngolaAntigua and BarbudaArab WorldArgentinaArmeniaArubaAustraliaAustriaAzerbaijanBahamas, TheBahrainBangladeshBarbadosBelarusBelgiumBelizeBeninBermudaBhutanBoliviaBosnia and HerzegovinaBotswanaBrazilBrunei DarussalamBulgariaBurkina FasoBurundiCabo VerdeCambodiaCameroonCanadaCaribbean small statesCentral African RepublicCentral Europe and the BalticsChadChileChinaColombiaComorosCongo, Dem. Rep.Congo, Rep.Costa RicaCote d'IvoireCroatiaCubaCyprusCzech RepublicDenmarkDominicaDominican RepublicEarly-demographic dividendEast Asia & PacificEast Asia & Pacific (excluding high income)East Asia & Pacific (IDA & IBRD countries)EcuadorEgypt, Arab Rep.El SalvadorEquatorial GuineaEritreaEstoniaEuro areaEurope & Central AsiaEurope & Central Asia (excluding high income)Europe & Central Asia (IDA & IBRD countries)European UnionFaroe IslandsFijiFinlandFragile and conflict affected situationsFranceGabonGambia, TheGeorgiaGermanyGhanaGreeceGrenadaGuatemalaGuineaGuinea-BissauGuyanaHaitiHeavily indebted poor countries (HIPC)High incomeHondurasHong Kong SAR, ChinaHungaryIBRD onlyIcelandIDA & IBRD totalIDA blendIDA onlyIDA totalIndiaIndonesiaIran, Islamic Rep.IraqIrelandIsraelItalyJamaicaJapanJordanKazakhstanKenyaKiribatiKorea, Rep.KosovoKuwaitKyrgyz RepublicLao PDRLate-demographic dividendLatin America & Caribbean Latin America & Caribbean (excluding high income)Latin America & the Caribbean (IDA & IBRD countries)LatviaLeast developed countries: UN classificationLebanonLiberiaLibyaLithuaniaLow & middle incomeLow incomeLower middle incomeLuxembourgMacao SAR, ChinaMacedonia, FYRMadagascarMalawiMalaysiaMaldivesMaliMaltaMauritaniaMauritiusMexicoMiddle East & North AfricaMiddle East & North Africa (excluding high income)Middle East & North Africa (IDA & IBRD countries)Middle incomeMoldovaMongoliaMontenegroMoroccoMozambiqueMyanmarNamibiaNepalNetherlandsNew ZealandNicaraguaNigerNigeriaNorth AmericaNorwayOECD membersOmanOther small statesPacific island small statesPakistanPalauPanamaParaguayPeruPhilippinesPolandPortugalPost-demographic dividendPre-demographic dividendPuerto RicoQatarRomaniaRussian FederationRwandaSamoaSaudi ArabiaSenegalSerbiaSeychellesSierra LeoneSingaporeSlovak RepublicSloveniaSmall statesSolomon IslandsSouth AfricaSouth AsiaSouth Asia (IDA & IBRD)South SudanSpainSri LankaSt. Kitts and NevisSt. LuciaSt. Vincent and the GrenadinesSub-Saharan Africa Sub-Saharan Africa (excluding high income)Sub-Saharan Africa (IDA & IBRD countries)SudanSurinameSwazilandSwedenSwitzerlandTajikistanTanzaniaThailandTimor-LesteTogoTongaTrinidad and TobagoTunisiaTurkeyTurkmenistanUgandaUkraineUnited Arab EmiratesUnited KingdomUnited StatesUpper middle incomeUruguayUzbekistanVanuatuVenezuela, RBVietnamWest Bank and GazaWorldYemen, Rep.ZambiaZimbabwe Timeline:
This timeline shows a graph from 1982 to 2016 of Antigua and Barbuda. No data until 1981. Number of actual observations by date: 35.
Source name:
World Development Indicators
Source organization:
World Bank national accounts data, and OECD National Accounts data files.
Categories, topics:
Economy & Growth
Last updated:
apr 23, 2017
Indicators value changes by year
Minimum:
510.061 mln
jan 1, 1982
Maximum:
1.762 bln
jan 1, 2008
At the date of observation
Value
Absolute change
Change from previous value
jan 1, 1982
510.061 mln
+510.061 mln
0.0%
jan 1, 1983
532.024 mln
+21.963 mln
4.31%
jan 1, 1984
615.236 mln
+83.211 mln
15.64%
jan 1, 1985
556.791 mln
-58.445 mln
-9.5%
jan 1, 1986
589.592 mln
+32.801 mln
5.89%
jan 1, 1987
698.381 mln
+108.789 mln
18.45%
jan 1, 1988
868.794 mln
+170.413 mln
24.4%
jan 1, 1989
861.812 mln
-6.982 mln
-0.8%
jan 1, 1990
772.432 mln
-89.381 mln
-10.37%
jan 1, 1991
847.252 mln
+74.821 mln
9.69%
jan 1, 1992
778.104 mln
-69.148 mln
-8.16%
jan 1, 1993
776.167 mln
-1.937 mln
-0.25%
jan 1, 1994
806.324 mln
+30.158 mln
3.89%
jan 1, 1995
826.348 mln
+20.023 mln
2.48%
jan 1, 1996
834.398 mln
+8.05 mln
0.97%
jan 1, 1997
955.226 mln
+120.828 mln
14.48%
jan 1, 1998
1.031 bln
+75.851 mln
7.94%
jan 1, 1999
1.03 bln
-1.19 mln
-0.12%
jan 1, 2000
1.052 bln
+22.139 mln
2.15%
jan 1, 2001
1.146 bln
+94.103 mln
8.94%
jan 1, 2002
1.079 bln
-66.902 mln
-5.84%
jan 1, 2003
1.11 bln
+30.758 mln
2.85%
jan 1, 2004
1.168 bln
+57.677 mln
5.2%
jan 1, 2005
1.267 bln
+99.711 mln
8.54%
jan 1, 2006
1.321 bln
+53.667 mln
4.23%
jan 1, 2007
1.573 bln
+251.966 mln
19.07%
jan 1, 2008
1.762 bln
+188.893 mln
12.01%
jan 1, 2009
1.727 bln
-34.586 mln
-1.96%
jan 1, 2010
1.372 bln
-355.366 mln
-20.57%
jan 1, 2011
1.291 bln
-81.311 mln
-5.93%
jan 1, 2012
1.217 bln
-73.278 mln
-5.68%
jan 1, 2013
1.31 bln
+92.751 mln
7.62%
jan 1, 2014
1.327 bln
+16.642 mln
1.27%
jan 1, 2015
1.361 bln
+33.882 mln
2.55%
jan 1, 2016
1.376 bln
+15.588 mln
1.15%
Ranking of countries by current statistics by years


Comments: