29
/
en
AIzaSyAYiBZKx7MnpbEhh9jyipgxe19OcubqV5w
April 1, 2024
185247
Madagascar
MDG
true
2
1
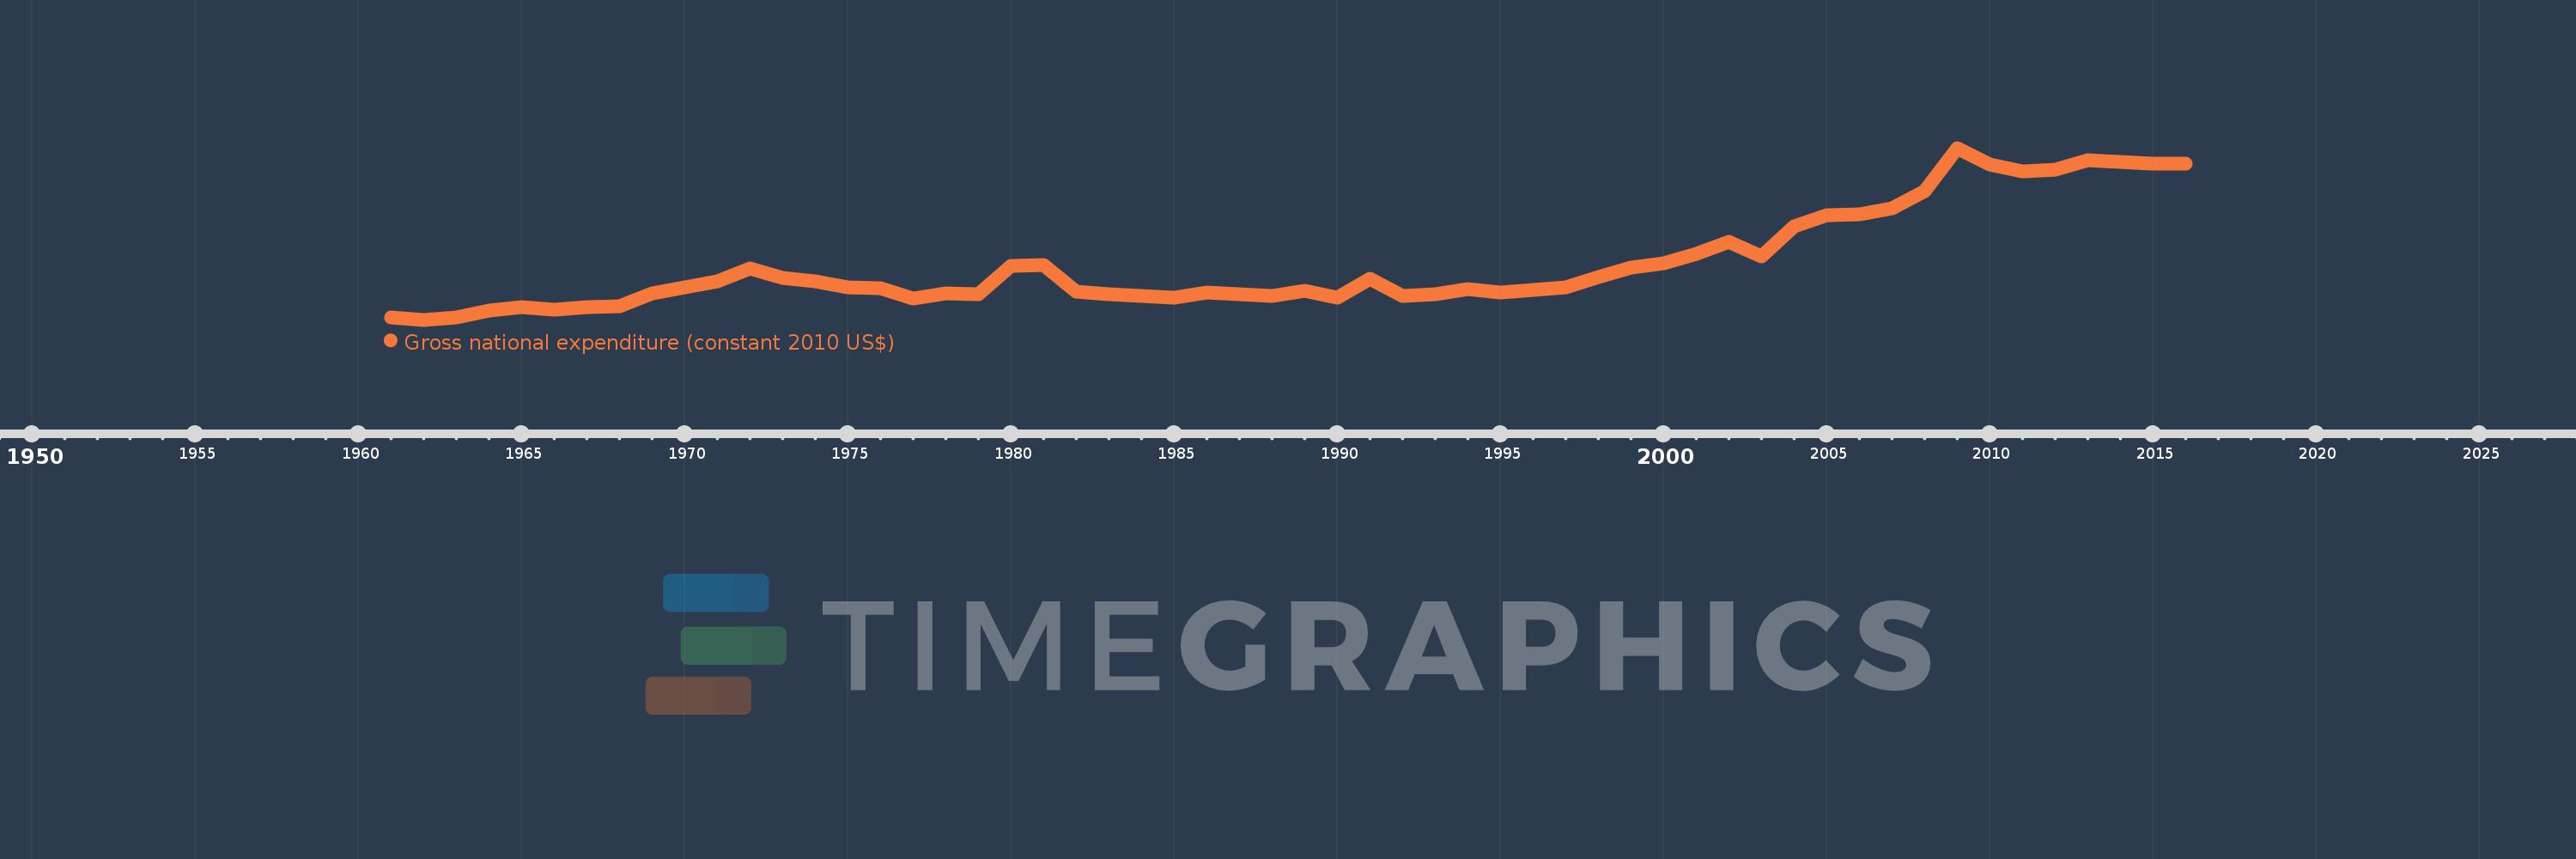
Gross national expenditure (constant 2010 US$)
2016,2015,2014,2013,2012,2011,2010,2009,2008,2007,2006,2005,2004,2003,2002,2001,2000,1999,1998,1997,1996,1995,1994,1993,1992,1991,1990,1989,1988,1987,1986,1985,1984,1983,1982,1981,1980,1979,1978,1977,1976,1975,1974,1973,1972,1971,1970,1969,1968,1967,1966,1965,1964,1963,1962,1961
This statistics in other country:
AfghanistanAlbaniaAlgeriaAngolaAntigua and BarbudaArab WorldArgentinaArmeniaArubaAustraliaAustriaAzerbaijanBahamas, TheBahrainBangladeshBarbadosBelarusBelgiumBelizeBeninBermudaBhutanBoliviaBosnia and HerzegovinaBotswanaBrazilBrunei DarussalamBulgariaBurkina FasoBurundiCabo VerdeCambodiaCameroonCanadaCaribbean small statesCentral African RepublicCentral Europe and the BalticsChadChileChinaColombiaComorosCongo, Dem. Rep.Congo, Rep.Costa RicaCote d'IvoireCroatiaCubaCyprusCzech RepublicDenmarkDominicaDominican RepublicEarly-demographic dividendEast Asia & PacificEast Asia & Pacific (excluding high income)East Asia & Pacific (IDA & IBRD countries)EcuadorEgypt, Arab Rep.El SalvadorEquatorial GuineaEritreaEstoniaEuro areaEurope & Central AsiaEurope & Central Asia (excluding high income)Europe & Central Asia (IDA & IBRD countries)European UnionFaroe IslandsFijiFinlandFragile and conflict affected situationsFranceGabonGambia, TheGeorgiaGermanyGhanaGreeceGrenadaGuatemalaGuineaGuinea-BissauGuyanaHaitiHeavily indebted poor countries (HIPC)High incomeHondurasHong Kong SAR, ChinaHungaryIBRD onlyIcelandIDA & IBRD totalIDA blendIDA onlyIDA totalIndiaIndonesiaIran, Islamic Rep.IraqIrelandIsraelItalyJamaicaJapanJordanKazakhstanKenyaKiribatiKorea, Rep.KosovoKuwaitKyrgyz RepublicLao PDRLate-demographic dividendLatin America & Caribbean Latin America & Caribbean (excluding high income)Latin America & the Caribbean (IDA & IBRD countries)LatviaLeast developed countries: UN classificationLebanonLiberiaLibyaLithuaniaLow & middle incomeLow incomeLower middle incomeLuxembourgMacao SAR, ChinaMacedonia, FYRMadagascarMalawiMalaysiaMaldivesMaliMaltaMauritaniaMauritiusMexicoMiddle East & North AfricaMiddle East & North Africa (excluding high income)Middle East & North Africa (IDA & IBRD countries)Middle incomeMoldovaMongoliaMontenegroMoroccoMozambiqueMyanmarNamibiaNepalNetherlandsNew ZealandNicaraguaNigerNigeriaNorth AmericaNorwayOECD membersOmanOther small statesPacific island small statesPakistanPalauPanamaParaguayPeruPhilippinesPolandPortugalPost-demographic dividendPre-demographic dividendPuerto RicoQatarRomaniaRussian FederationRwandaSamoaSaudi ArabiaSenegalSerbiaSeychellesSierra LeoneSingaporeSlovak RepublicSloveniaSmall statesSolomon IslandsSouth AfricaSouth AsiaSouth Asia (IDA & IBRD)South SudanSpainSri LankaSt. Kitts and NevisSt. LuciaSt. Vincent and the GrenadinesSub-Saharan Africa Sub-Saharan Africa (excluding high income)Sub-Saharan Africa (IDA & IBRD countries)SudanSurinameSwazilandSwedenSwitzerlandTajikistanTanzaniaThailandTimor-LesteTogoTongaTrinidad and TobagoTunisiaTurkeyTurkmenistanUgandaUkraineUnited Arab EmiratesUnited KingdomUnited StatesUpper middle incomeUruguayUzbekistanVanuatuVenezuela, RBVietnamWest Bank and GazaWorldYemen, Rep.ZambiaZimbabwe Timeline:
This timeline shows a graph from 1961 to 2016 of Madagascar. No data until 1960. Number of actual observations by date: 56.
Source name:
World Development Indicators
Source organization:
World Bank national accounts data, and OECD National Accounts data files.
Categories, topics:
Economy & Growth
Last updated:
apr 23, 2017
Indicators value changes by year
Minimum:
4.434 bln
jan 1, 1962
Maximum:
11.243 bln
jan 1, 2009
At the date of observation
Value
Absolute change
Change from previous value
jan 1, 1961
4.515 bln
+4.515 bln
0.0%
jan 1, 1962
4.434 bln
-80.49 mln
-1.78%
jan 1, 1963
4.529 bln
+94.653 mln
2.13%
jan 1, 1964
4.815 bln
+286.318 mln
6.32%
jan 1, 1965
4.943 bln
+128.01 mln
2.66%
jan 1, 1966
4.848 bln
-94.903 mln
-1.92%
jan 1, 1967
4.942 bln
+94.089 mln
1.94%
jan 1, 1968
4.966 bln
+23.288 mln
0.47%
jan 1, 1969
5.491 bln
+525.213 mln
10.58%
jan 1, 1970
5.727 bln
+236.387 mln
4.31%
jan 1, 1971
5.966 bln
+238.489 mln
4.16%
jan 1, 1972
6.477 bln
+511.184 mln
8.57%
jan 1, 1973
6.087 bln
-389.539 mln
-6.01%
jan 1, 1974
5.945 bln
-142.068 mln
-2.33%
jan 1, 1975
5.715 bln
-230.509 mln
-3.88%
jan 1, 1976
5.684 bln
-30.827 mln
-0.54%
jan 1, 1977
5.292 bln
-392.455 mln
-6.9%
jan 1, 1978
5.49 bln
+198.75 mln
3.76%
jan 1, 1979
5.452 bln
-38.527 mln
-0.7%
jan 1, 1980
6.558 bln
+1.107 bln
20.3%
jan 1, 1981
6.6 bln
+41.425 mln
0.63%
jan 1, 1982
5.532 bln
-1.068 bln
-16.18%
jan 1, 1983
5.454 bln
-77.645 mln
-1.4%
jan 1, 1984
5.377 bln
-77.188 mln
-1.42%
jan 1, 1985
5.296 bln
-80.586 mln
-1.5%
jan 1, 1986
5.501 bln
+204.592 mln
3.86%
jan 1, 1987
5.441 bln
-60.046 mln
-1.09%
jan 1, 1988
5.375 bln
-66.248 mln
-1.22%
jan 1, 1989
5.573 bln
+198.044 mln
3.68%
jan 1, 1990
5.31 bln
-262.945 mln
-4.72%
jan 1, 1991
6.06 bln
+750.345 mln
14.13%
jan 1, 1992
5.375 bln
-685.402 mln
-11.31%
jan 1, 1993
5.44 bln
+65.249 mln
1.21%
jan 1, 1994
5.658 bln
+217.729 mln
4.0%
jan 1, 1995
5.527 bln
-130.71 mln
-2.31%
jan 1, 1996
5.618 bln
+90.576 mln
1.64%
jan 1, 1997
5.731 bln
+113.384 mln
2.02%
jan 1, 1998
6.113 bln
+381.602 mln
6.66%
jan 1, 1999
6.488 bln
+375.579 mln
6.14%
jan 1, 2000
6.669 bln
+180.763 mln
2.79%
jan 1, 2001
7.057 bln
+387.672 mln
5.81%
jan 1, 2002
7.536 bln
+479.098 mln
6.79%
jan 1, 2003
6.948 bln
-588.2 mln
-7.81%
jan 1, 2004
8.13 bln
+1.183 bln
17.02%
jan 1, 2005
8.589 bln
+458.619 mln
5.64%
jan 1, 2006
8.628 bln
+39.014 mln
0.45%
jan 1, 2007
8.857 bln
+229.057 mln
2.65%
jan 1, 2008
9.519 bln
+662.636 mln
7.48%
jan 1, 2009
11.243 bln
+1.724 bln
18.11%
jan 1, 2010
10.595 bln
-647.547 mln
-5.76%
jan 1, 2011
10.308 bln
-287.576 mln
-2.71%
jan 1, 2012
10.393 bln
+85.331 mln
0.83%
jan 1, 2013
10.757 bln
+363.646 mln
3.5%
jan 1, 2014
10.676 bln
-80.648 mln
-0.75%
jan 1, 2015
10.606 bln
-70.627 mln
-0.66%
jan 1, 2016
10.624 bln
+18.119 mln
0.17%
Ranking of countries by current statistics by years


Comments: