29
/
en
AIzaSyAYiBZKx7MnpbEhh9jyipgxe19OcubqV5w
April 1, 2024
31637
Europe & Central Asia (excluding high income)
ECA
false
2
1
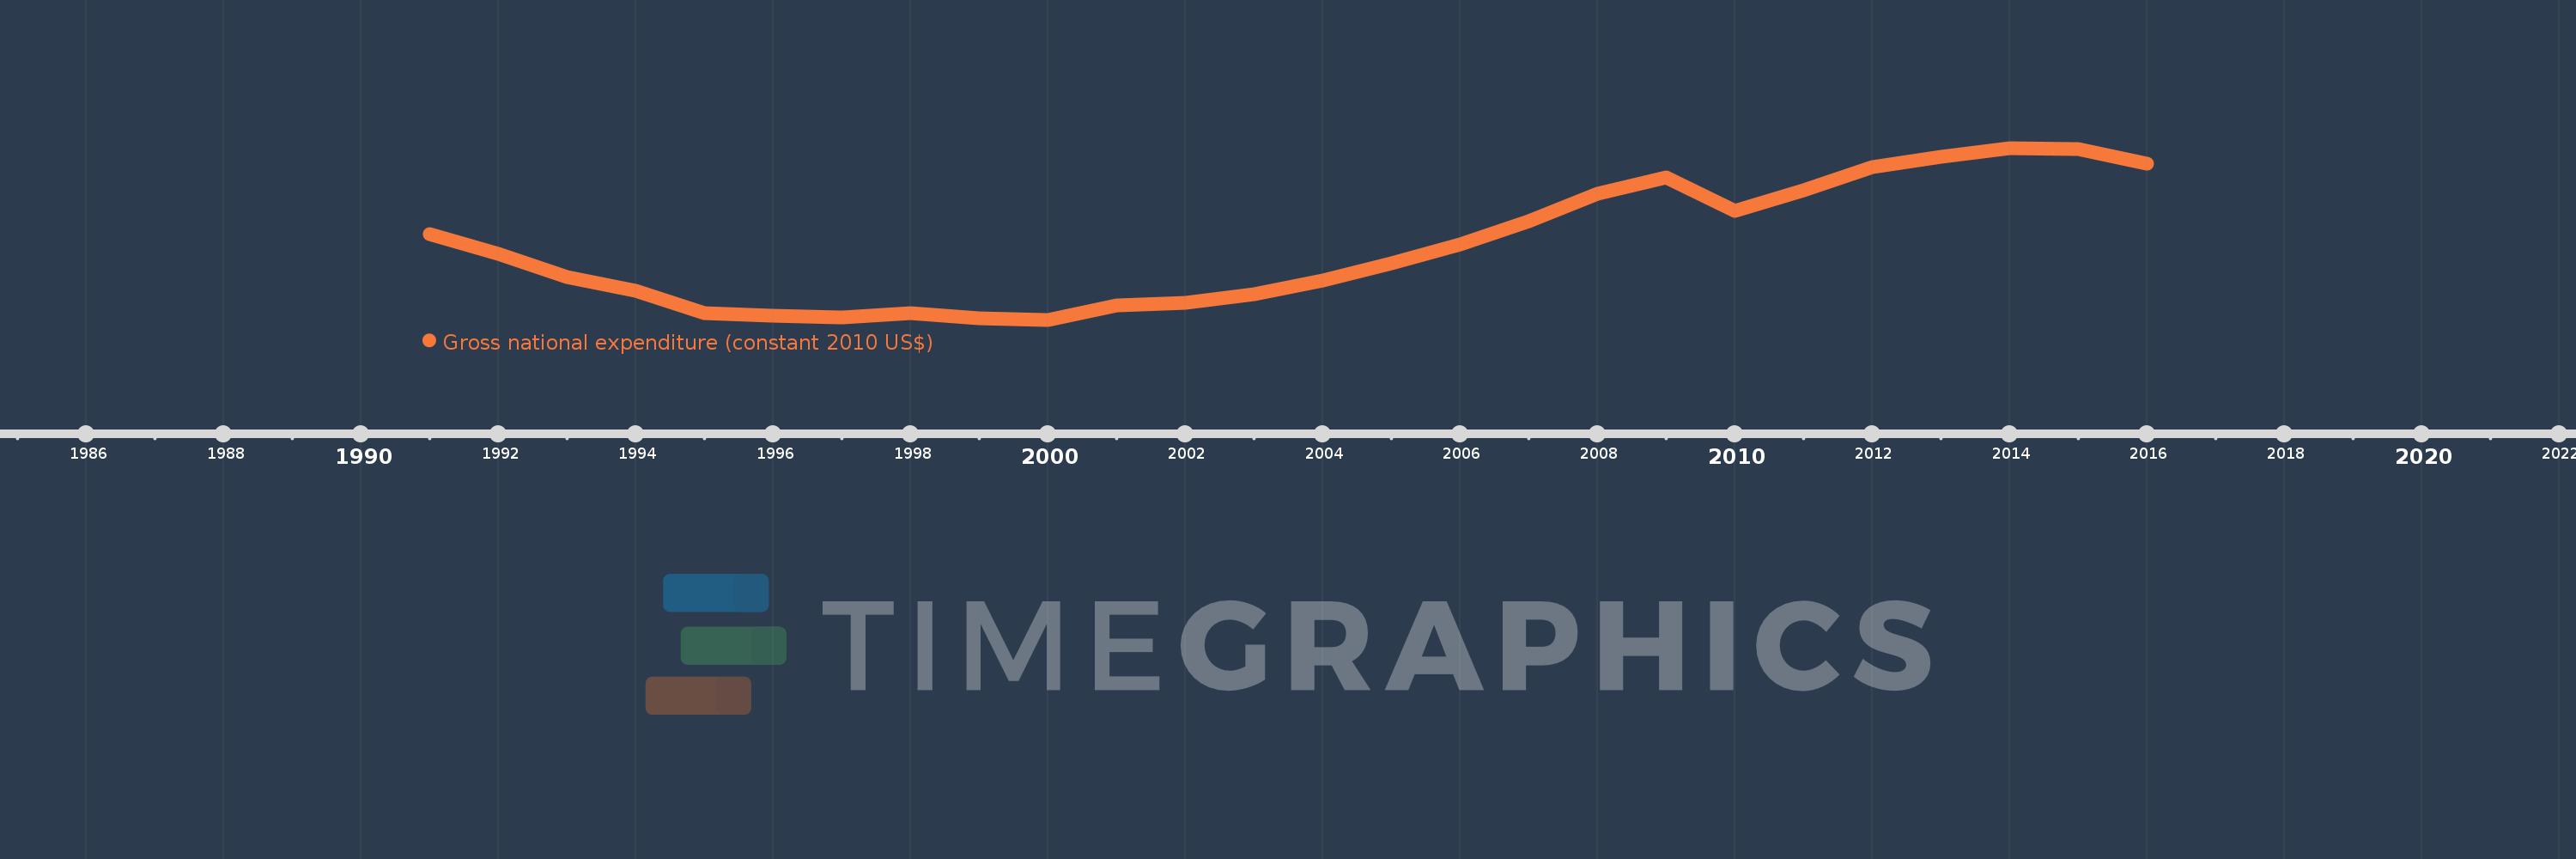
Gross national expenditure (constant 2010 US$)
2016,2015,2014,2013,2012,2011,2010,2009,2008,2007,2006,2005,2004,2003,2002,2001,2000,1999,1998,1997,1996,1995,1994,1993,1992,1991
This statistics in other country:
AfghanistanAlbaniaAlgeriaAngolaAntigua and BarbudaArab WorldArgentinaArmeniaArubaAustraliaAustriaAzerbaijanBahamas, TheBahrainBangladeshBarbadosBelarusBelgiumBelizeBeninBermudaBhutanBoliviaBosnia and HerzegovinaBotswanaBrazilBrunei DarussalamBulgariaBurkina FasoBurundiCabo VerdeCambodiaCameroonCanadaCaribbean small statesCentral African RepublicCentral Europe and the BalticsChadChileChinaColombiaComorosCongo, Dem. Rep.Congo, Rep.Costa RicaCote d'IvoireCroatiaCubaCyprusCzech RepublicDenmarkDominicaDominican RepublicEarly-demographic dividendEast Asia & PacificEast Asia & Pacific (excluding high income)East Asia & Pacific (IDA & IBRD countries)EcuadorEgypt, Arab Rep.El SalvadorEquatorial GuineaEritreaEstoniaEuro areaEurope & Central AsiaEurope & Central Asia (excluding high income)Europe & Central Asia (IDA & IBRD countries)European UnionFaroe IslandsFijiFinlandFragile and conflict affected situationsFranceGabonGambia, TheGeorgiaGermanyGhanaGreeceGrenadaGuatemalaGuineaGuinea-BissauGuyanaHaitiHeavily indebted poor countries (HIPC)High incomeHondurasHong Kong SAR, ChinaHungaryIBRD onlyIcelandIDA & IBRD totalIDA blendIDA onlyIDA totalIndiaIndonesiaIran, Islamic Rep.IraqIrelandIsraelItalyJamaicaJapanJordanKazakhstanKenyaKiribatiKorea, Rep.KosovoKuwaitKyrgyz RepublicLao PDRLate-demographic dividendLatin America & Caribbean Latin America & Caribbean (excluding high income)Latin America & the Caribbean (IDA & IBRD countries)LatviaLeast developed countries: UN classificationLebanonLiberiaLibyaLithuaniaLow & middle incomeLow incomeLower middle incomeLuxembourgMacao SAR, ChinaMacedonia, FYRMadagascarMalawiMalaysiaMaldivesMaliMaltaMauritaniaMauritiusMexicoMiddle East & North AfricaMiddle East & North Africa (excluding high income)Middle East & North Africa (IDA & IBRD countries)Middle incomeMoldovaMongoliaMontenegroMoroccoMozambiqueMyanmarNamibiaNepalNetherlandsNew ZealandNicaraguaNigerNigeriaNorth AmericaNorwayOECD membersOmanOther small statesPacific island small statesPakistanPalauPanamaParaguayPeruPhilippinesPolandPortugalPost-demographic dividendPre-demographic dividendPuerto RicoQatarRomaniaRussian FederationRwandaSamoaSaudi ArabiaSenegalSerbiaSeychellesSierra LeoneSingaporeSlovak RepublicSloveniaSmall statesSolomon IslandsSouth AfricaSouth AsiaSouth Asia (IDA & IBRD)South SudanSpainSri LankaSt. Kitts and NevisSt. LuciaSt. Vincent and the GrenadinesSub-Saharan Africa Sub-Saharan Africa (excluding high income)Sub-Saharan Africa (IDA & IBRD countries)SudanSurinameSwazilandSwedenSwitzerlandTajikistanTanzaniaThailandTimor-LesteTogoTongaTrinidad and TobagoTunisiaTurkeyTurkmenistanUgandaUkraineUnited Arab EmiratesUnited KingdomUnited StatesUpper middle incomeUruguayUzbekistanVanuatuVenezuela, RBVietnamWest Bank and GazaWorldYemen, Rep.ZambiaZimbabwe Timeline:
This timeline shows a graph from 1991 to 2016 of Europe & Central Asia (excluding high income). No data until 1990. Number of actual observations by date: 26.
Source name:
World Development Indicators
Source organization:
World Bank national accounts data, and OECD National Accounts data files.
Categories, topics:
Economy & Growth
Last updated:
apr 23, 2017
Indicators value changes by year
Minimum:
1.592 trl
jan 1, 2000
Maximum:
3.432 trl
jan 1, 2014
At the date of observation
Value
Absolute change
Change from previous value
jan 1, 1991
2.507 trl
+2.507 trl
0.0%
jan 1, 1992
2.294 trl
-213.583 bln
-8.52%
jan 1, 1993
2.048 trl
-246.224 bln
-10.73%
jan 1, 1994
1.906 trl
-142.086 bln
-6.94%
jan 1, 1995
1.667 trl
-239.049 bln
-12.54%
jan 1, 1996
1.634 trl
-32.502 bln
-1.95%
jan 1, 1997
1.613 trl
-20.583 bln
-1.26%
jan 1, 1998
1.662 trl
+48.185 bln
2.99%
jan 1, 1999
1.606 trl
-55.913 bln
-3.36%
jan 1, 2000
1.592 trl
-13.248 bln
-0.83%
jan 1, 2001
1.742 trl
+149.541 bln
9.39%
jan 1, 2002
1.772 trl
+30.189 bln
1.73%
jan 1, 2003
1.87 trl
+97.536 bln
5.5%
jan 1, 2004
2.009 trl
+138.904 bln
7.43%
jan 1, 2005
2.2 trl
+191.212 bln
9.52%
jan 1, 2006
2.398 trl
+197.647 bln
8.98%
jan 1, 2007
2.645 trl
+247.943 bln
10.34%
jan 1, 2008
2.938 trl
+292.109 bln
11.04%
jan 1, 2009
3.114 trl
+176.289 bln
6.0%
jan 1, 2010
2.761 trl
-353.118 bln
-11.34%
jan 1, 2011
2.976 trl
+214.96 bln
7.79%
jan 1, 2012
3.222 trl
+246.652 bln
8.29%
jan 1, 2013
3.334 trl
+111.453 bln
3.46%
jan 1, 2014
3.432 trl
+98.024 bln
2.94%
jan 1, 2015
3.422 trl
-9.94 bln
-0.29%
jan 1, 2016
3.264 trl
-157.431 bln
-4.6%
Ranking of countries by current statistics by years


Comments: