29
/
en
AIzaSyAYiBZKx7MnpbEhh9jyipgxe19OcubqV5w
April 1, 2024
210439
Nicaragua
NIC
true
2
1
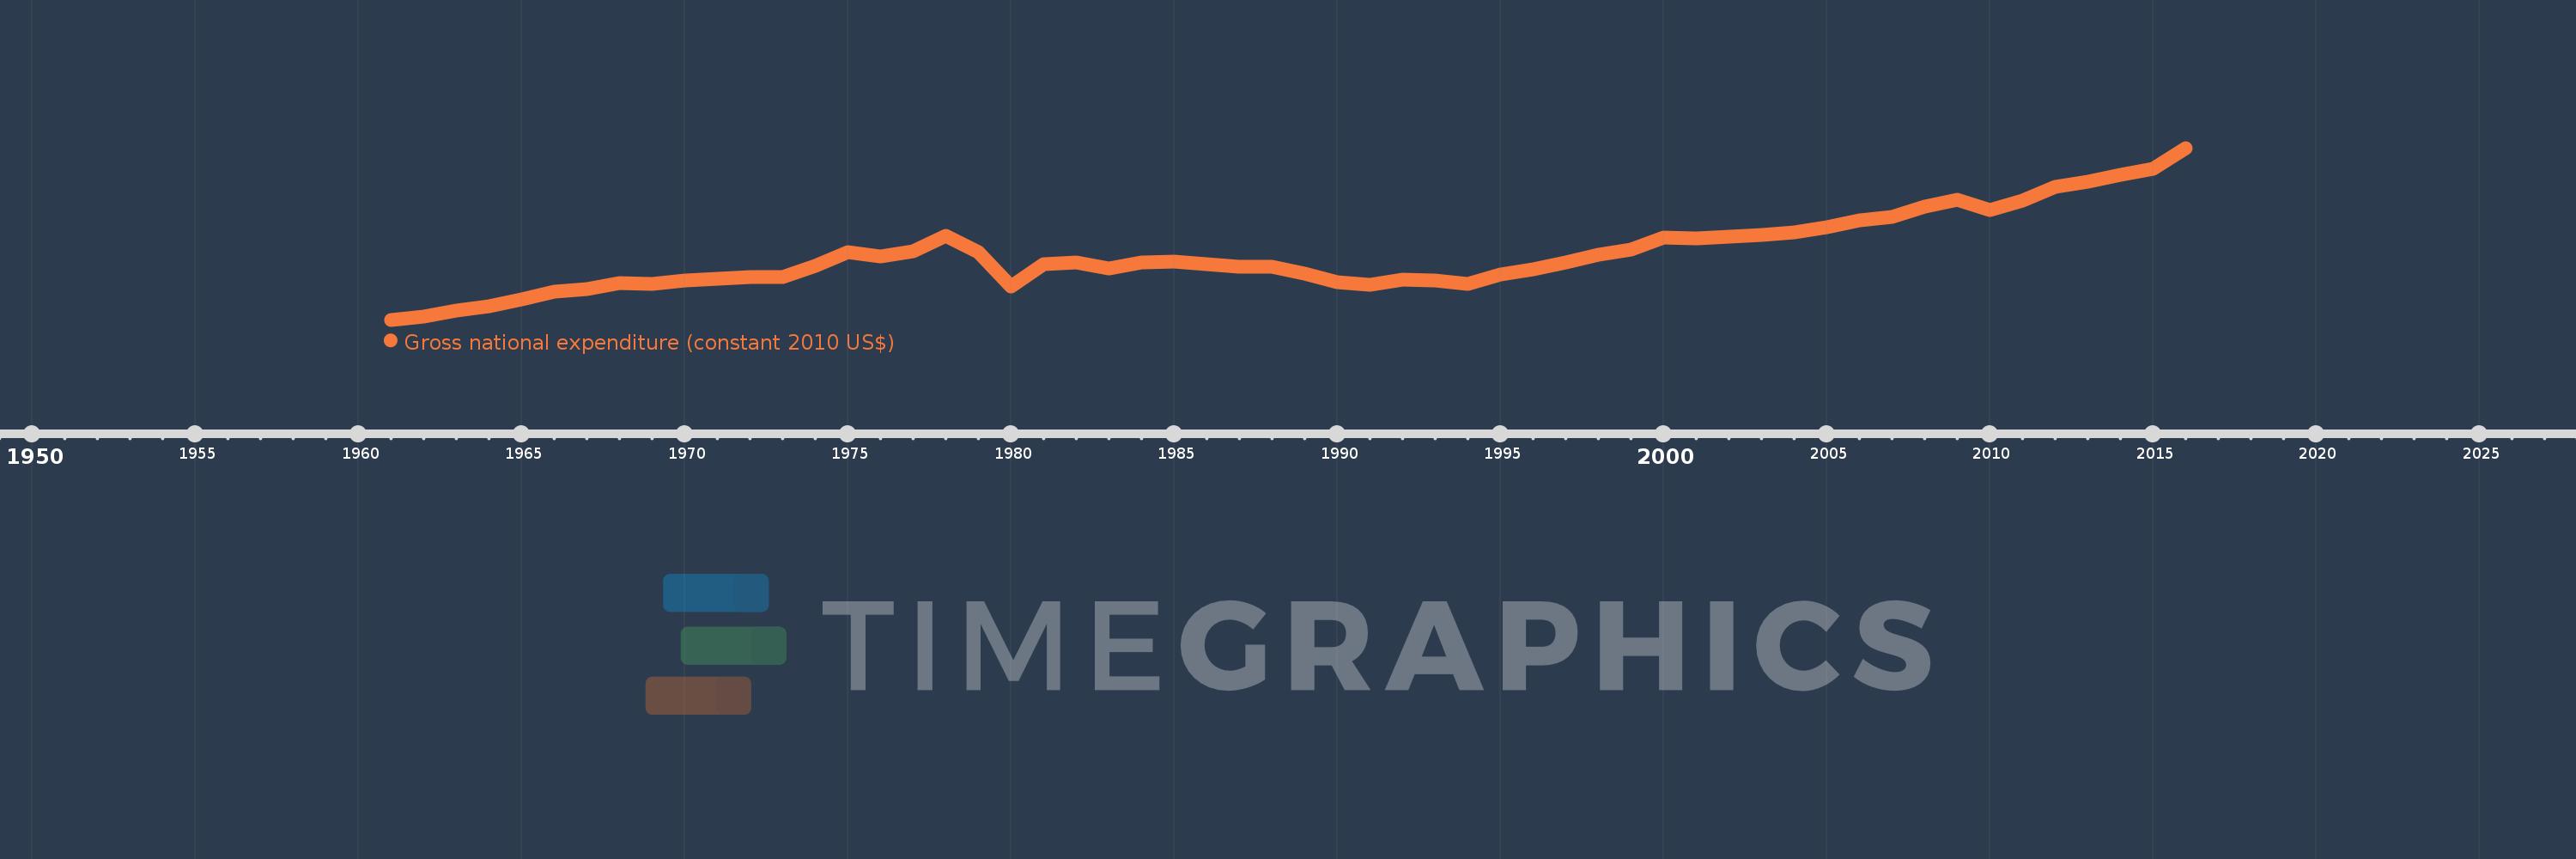
Gross national expenditure (constant 2010 US$)
2016,2015,2014,2013,2012,2011,2010,2009,2008,2007,2006,2005,2004,2003,2002,2001,2000,1999,1998,1997,1996,1995,1994,1993,1992,1991,1990,1989,1988,1987,1986,1985,1984,1983,1982,1981,1980,1979,1978,1977,1976,1975,1974,1973,1972,1971,1970,1969,1968,1967,1966,1965,1964,1963,1962,1961
This statistics in other country:
AfghanistanAlbaniaAlgeriaAngolaAntigua and BarbudaArab WorldArgentinaArmeniaArubaAustraliaAustriaAzerbaijanBahamas, TheBahrainBangladeshBarbadosBelarusBelgiumBelizeBeninBermudaBhutanBoliviaBosnia and HerzegovinaBotswanaBrazilBrunei DarussalamBulgariaBurkina FasoBurundiCabo VerdeCambodiaCameroonCanadaCaribbean small statesCentral African RepublicCentral Europe and the BalticsChadChileChinaColombiaComorosCongo, Dem. Rep.Congo, Rep.Costa RicaCote d'IvoireCroatiaCubaCyprusCzech RepublicDenmarkDominicaDominican RepublicEarly-demographic dividendEast Asia & PacificEast Asia & Pacific (excluding high income)East Asia & Pacific (IDA & IBRD countries)EcuadorEgypt, Arab Rep.El SalvadorEquatorial GuineaEritreaEstoniaEuro areaEurope & Central AsiaEurope & Central Asia (excluding high income)Europe & Central Asia (IDA & IBRD countries)European UnionFaroe IslandsFijiFinlandFragile and conflict affected situationsFranceGabonGambia, TheGeorgiaGermanyGhanaGreeceGrenadaGuatemalaGuineaGuinea-BissauGuyanaHaitiHeavily indebted poor countries (HIPC)High incomeHondurasHong Kong SAR, ChinaHungaryIBRD onlyIcelandIDA & IBRD totalIDA blendIDA onlyIDA totalIndiaIndonesiaIran, Islamic Rep.IraqIrelandIsraelItalyJamaicaJapanJordanKazakhstanKenyaKiribatiKorea, Rep.KosovoKuwaitKyrgyz RepublicLao PDRLate-demographic dividendLatin America & Caribbean Latin America & Caribbean (excluding high income)Latin America & the Caribbean (IDA & IBRD countries)LatviaLeast developed countries: UN classificationLebanonLiberiaLibyaLithuaniaLow & middle incomeLow incomeLower middle incomeLuxembourgMacao SAR, ChinaMacedonia, FYRMadagascarMalawiMalaysiaMaldivesMaliMaltaMauritaniaMauritiusMexicoMiddle East & North AfricaMiddle East & North Africa (excluding high income)Middle East & North Africa (IDA & IBRD countries)Middle incomeMoldovaMongoliaMontenegroMoroccoMozambiqueMyanmarNamibiaNepalNetherlandsNew ZealandNicaraguaNigerNigeriaNorth AmericaNorwayOECD membersOmanOther small statesPacific island small statesPakistanPalauPanamaParaguayPeruPhilippinesPolandPortugalPost-demographic dividendPre-demographic dividendPuerto RicoQatarRomaniaRussian FederationRwandaSamoaSaudi ArabiaSenegalSerbiaSeychellesSierra LeoneSingaporeSlovak RepublicSloveniaSmall statesSolomon IslandsSouth AfricaSouth AsiaSouth Asia (IDA & IBRD)South SudanSpainSri LankaSt. Kitts and NevisSt. LuciaSt. Vincent and the GrenadinesSub-Saharan Africa Sub-Saharan Africa (excluding high income)Sub-Saharan Africa (IDA & IBRD countries)SudanSurinameSwazilandSwedenSwitzerlandTajikistanTanzaniaThailandTimor-LesteTogoTongaTrinidad and TobagoTunisiaTurkeyTurkmenistanUgandaUkraineUnited Arab EmiratesUnited KingdomUnited StatesUpper middle incomeUruguayUzbekistanVanuatuVenezuela, RBVietnamWest Bank and GazaWorldYemen, Rep.ZambiaZimbabwe Timeline:
This timeline shows a graph from 1961 to 2016 of Nicaragua. No data until 1960. Number of actual observations by date: 56.
Source name:
World Development Indicators
Source organization:
World Bank national accounts data, and OECD National Accounts data files.
Categories, topics:
Economy & Growth
Last updated:
apr 23, 2017
Indicators value changes by year
Minimum:
2.825 bln
jan 1, 1961
Maximum:
13.773 bln
jan 1, 2016
At the date of observation
Value
Absolute change
Change from previous value
jan 1, 1961
2.825 bln
+2.825 bln
0.0%
jan 1, 1962
3.017 bln
+191.284 mln
6.77%
jan 1, 1963
3.4 bln
+383.63 mln
12.72%
jan 1, 1964
3.697 bln
+296.613 mln
8.72%
jan 1, 1965
4.132 bln
+435.247 mln
11.77%
jan 1, 1966
4.605 bln
+473.387 mln
11.46%
jan 1, 1967
4.782 bln
+176.375 mln
3.83%
jan 1, 1968
5.182 bln
+399.737 mln
8.36%
jan 1, 1969
5.107 bln
-74.83 mln
-1.44%
jan 1, 1970
5.338 bln
+231.744 mln
4.54%
jan 1, 1971
5.423 bln
+84.869 mln
1.59%
jan 1, 1972
5.568 bln
+144.822 mln
2.67%
jan 1, 1973
5.532 bln
-36.209 mln
-0.65%
jan 1, 1974
6.237 bln
+704.642 mln
12.74%
jan 1, 1975
7.106 bln
+869.671 mln
13.94%
jan 1, 1976
6.851 bln
-254.792 mln
-3.59%
jan 1, 1977
7.185 bln
+333.83 mln
4.87%
jan 1, 1978
8.18 bln
+994.303 mln
13.84%
jan 1, 1979
7.147 bln
-1.033 bln
-12.63%
jan 1, 1980
4.931 bln
-2.216 bln
-31.0%
jan 1, 1981
6.346 bln
+1.415 bln
28.69%
jan 1, 1982
6.467 bln
+121.033 mln
1.91%
jan 1, 1983
6.07 bln
-396.275 mln
-6.13%
jan 1, 1984
6.468 bln
+397.369 mln
6.55%
jan 1, 1985
6.514 bln
+46.166 mln
0.71%
jan 1, 1986
6.354 bln
-160.478 mln
-2.46%
jan 1, 1987
6.207 bln
-146.639 mln
-2.31%
jan 1, 1988
6.216 bln
+8.841 mln
0.14%
jan 1, 1989
5.754 bln
-461.848 mln
-7.43%
jan 1, 1990
5.229 bln
-524.515 mln
-9.12%
jan 1, 1991
5.07 bln
-159.677 mln
-3.05%
jan 1, 1992
5.359 bln
+289.047 mln
5.7%
jan 1, 1993
5.314 bln
-44.839 mln
-0.84%
jan 1, 1994
5.135 bln
-178.666 mln
-3.36%
jan 1, 1995
5.694 bln
+558.335 mln
10.87%
jan 1, 1996
6.048 bln
+354.019 mln
6.22%
jan 1, 1997
6.473 bln
+425.824 mln
7.04%
jan 1, 1998
6.981 bln
+507.986 mln
7.85%
jan 1, 1999
7.308 bln
+326.943 mln
4.68%
jan 1, 2000
8.075 bln
+766.39 mln
10.49%
jan 1, 2001
8.034 bln
-40.827 mln
-0.51%
jan 1, 2002
8.144 bln
+110.445 mln
1.37%
jan 1, 2003
8.246 bln
+101.37 mln
1.24%
jan 1, 2004
8.383 bln
+136.908 mln
1.66%
jan 1, 2005
8.722 bln
+339.772 mln
4.05%
jan 1, 2006
9.17 bln
+447.978 mln
5.14%
jan 1, 2007
9.391 bln
+220.473 mln
2.4%
jan 1, 2008
10.049 bln
+657.671 mln
7.0%
jan 1, 2009
10.498 bln
+449.239 mln
4.47%
jan 1, 2010
9.828 bln
-669.449 mln
-6.38%
jan 1, 2011
10.445 bln
+616.328 mln
6.27%
jan 1, 2012
11.29 bln
+845.386 mln
8.09%
jan 1, 2013
11.641 bln
+350.846 mln
3.11%
jan 1, 2014
12.038 bln
+397.321 mln
3.41%
jan 1, 2015
12.437 bln
+398.812 mln
3.31%
jan 1, 2016
13.773 bln
+1.336 bln
10.74%
Ranking of countries by current statistics by years


Comments: