29
/
en
AIzaSyAYiBZKx7MnpbEhh9jyipgxe19OcubqV5w
April 1, 2024
58145
South Asia (IDA & IBRD)
TSA
false
2
1
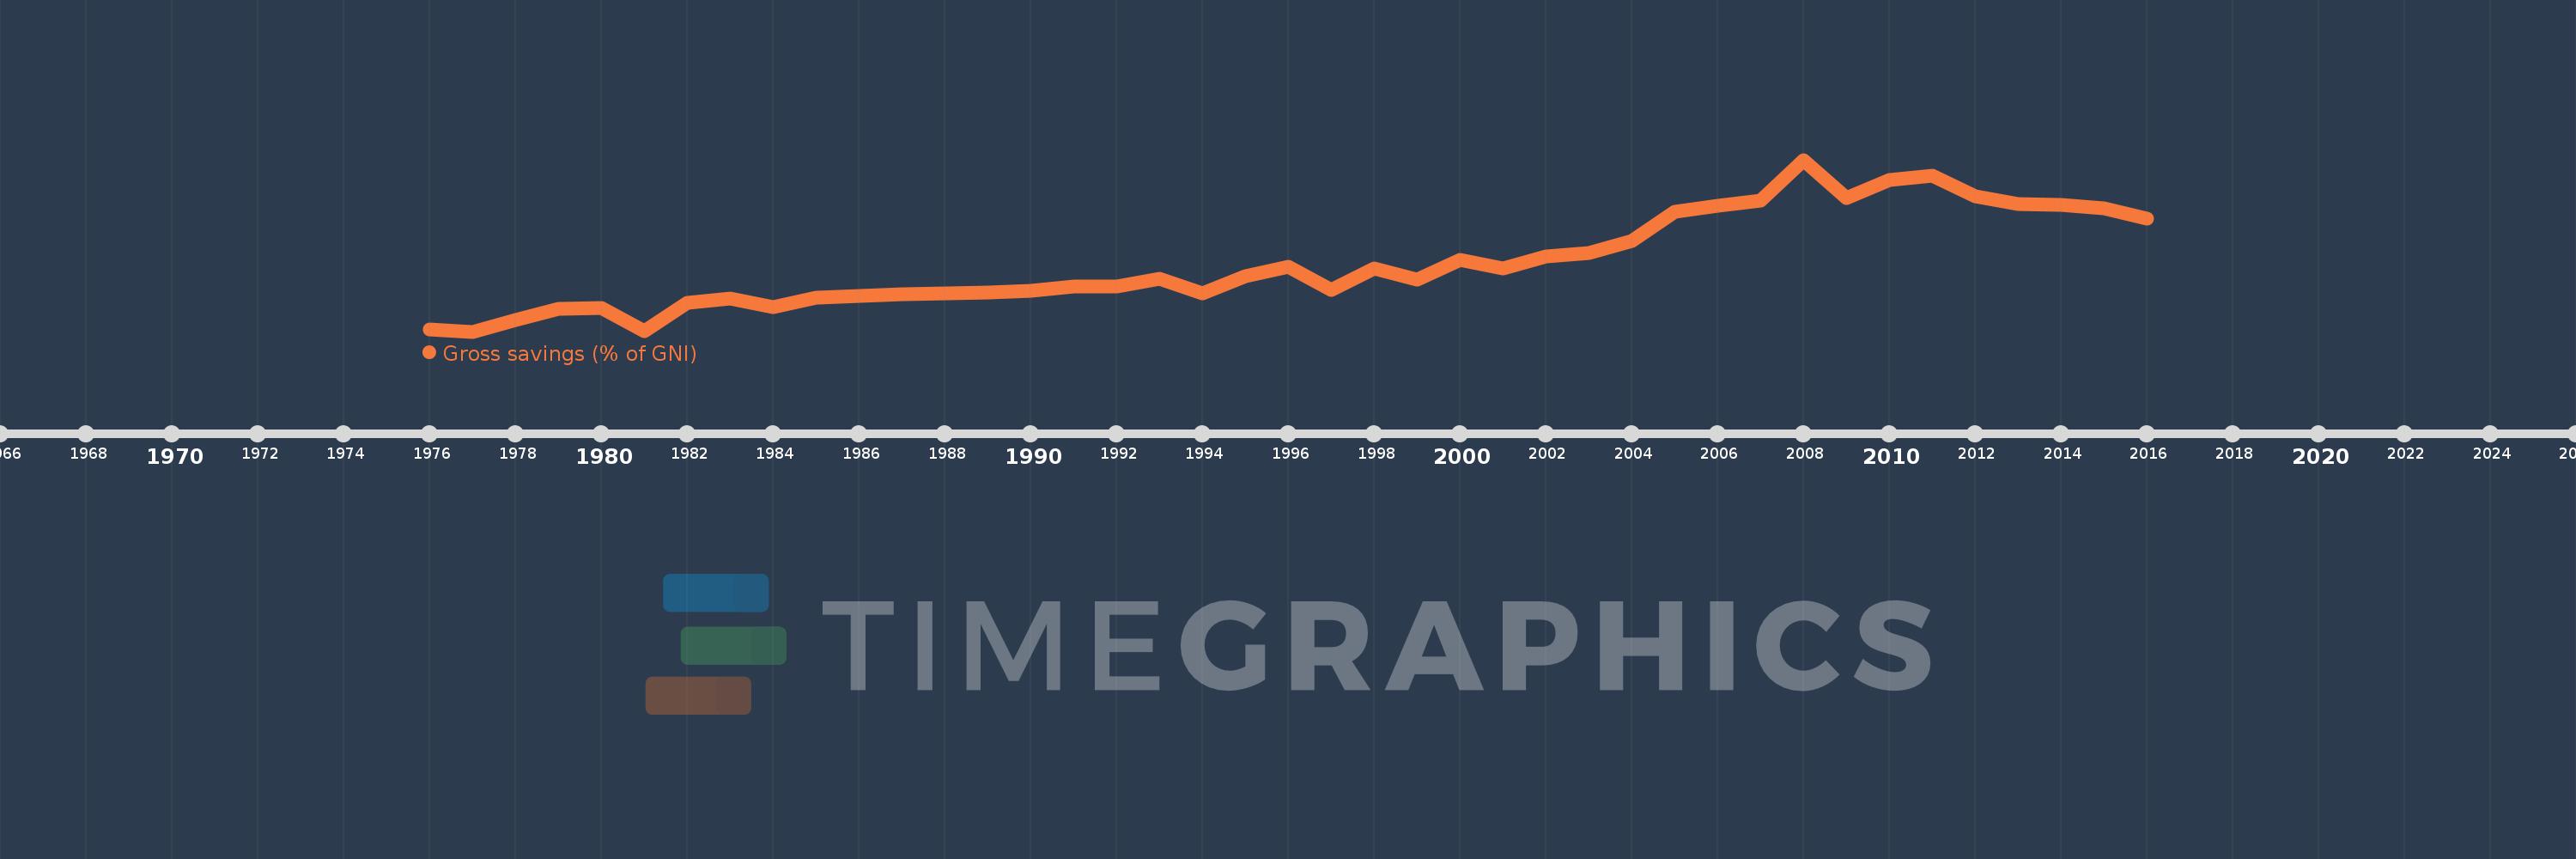
Gross savings (% of GNI)
2016,2015,2014,2013,2012,2011,2010,2009,2008,2007,2006,2005,2004,2003,2002,2001,2000,1999,1998,1997,1996,1995,1994,1993,1992,1991,1990,1989,1988,1987,1986,1985,1984,1983,1982,1981,1980,1979,1978,1977,1976
This statistics in other country:
AfghanistanAlbaniaAlgeriaAngolaAntigua and BarbudaArab WorldArgentinaArmeniaAustraliaAustriaAzerbaijanBahamas, TheBahrainBangladeshBarbadosBelarusBelgiumBelizeBeninBermudaBhutanBoliviaBosnia and HerzegovinaBotswanaBrazilBrunei DarussalamBulgariaBurkina FasoBurundiCabo VerdeCambodiaCameroonCanadaCaribbean small statesCentral African RepublicCentral Europe and the BalticsChadChileChinaColombiaComorosCongo, Dem. Rep.Congo, Rep.Costa RicaCote d'IvoireCroatiaCyprusCzech RepublicDenmarkDjiboutiDominicaDominican RepublicEarly-demographic dividendEast Asia & PacificEast Asia & Pacific (excluding high income)East Asia & Pacific (IDA & IBRD countries)EcuadorEgypt, Arab Rep.El SalvadorEquatorial GuineaEritreaEstoniaEthiopiaEuro areaEurope & Central AsiaEurope & Central Asia (excluding high income)Europe & Central Asia (IDA & IBRD countries)European UnionFaroe IslandsFijiFinlandFragile and conflict affected situationsFranceGabonGambia, TheGeorgiaGermanyGhanaGreeceGrenadaGuatemalaGuineaGuinea-BissauGuyanaHaitiHeavily indebted poor countries (HIPC)High incomeHondurasHong Kong SAR, ChinaHungaryIBRD onlyIcelandIDA & IBRD totalIDA blendIDA onlyIDA totalIndiaIndonesiaIran, Islamic Rep.IraqIrelandIsraelItalyJamaicaJapanJordanKazakhstanKenyaKiribatiKorea, Rep.KosovoKuwaitKyrgyz RepublicLao PDRLate-demographic dividendLatin America & Caribbean Latin America & Caribbean (excluding high income)Latin America & the Caribbean (IDA & IBRD countries)LatviaLeast developed countries: UN classificationLebanonLesothoLiberiaLibyaLithuaniaLow & middle incomeLow incomeLower middle incomeLuxembourgMacao SAR, ChinaMacedonia, FYRMadagascarMalawiMalaysiaMaldivesMaliMaltaMauritaniaMauritiusMexicoMiddle East & North AfricaMiddle East & North Africa (excluding high income)Middle East & North Africa (IDA & IBRD countries)Middle incomeMoldovaMongoliaMontenegroMoroccoMozambiqueNamibiaNepalNetherlandsNew ZealandNicaraguaNigerNigeriaNorth AmericaNorwayOECD membersOmanOther small statesPacific island small statesPakistanPanamaPapua New GuineaParaguayPeruPhilippinesPolandPortugalPost-demographic dividendPre-demographic dividendQatarRomaniaRussian FederationRwandaSaudi ArabiaSenegalSerbiaSeychellesSierra LeoneSingaporeSlovak RepublicSloveniaSmall statesSolomon IslandsSouth AfricaSouth AsiaSouth Asia (IDA & IBRD)South SudanSpainSri LankaSt. Kitts and NevisSt. LuciaSt. Vincent and the GrenadinesSub-Saharan Africa Sub-Saharan Africa (excluding high income)Sub-Saharan Africa (IDA & IBRD countries)SudanSurinameSwazilandSwedenSwitzerlandSyrian Arab RepublicTajikistanTanzaniaThailandTimor-LesteTogoTongaTrinidad and TobagoTunisiaTurkeyUgandaUkraineUnited KingdomUnited StatesUpper middle incomeUruguayVanuatuVenezuela, RBVietnamWest Bank and GazaWorldYemen, Rep.ZambiaZimbabwe Timeline:
This timeline shows a graph from 1976 to 2016 of South Asia (IDA & IBRD). No data until 1975. Number of actual observations by date: 41.
Source name:
World Development Indicators
Source organization:
World Bank national accounts data, and OECD National Accounts data files.
Categories, topics:
Economy & Growth
Last updated:
apr 23, 2017
Indicators value changes by year
Minimum:
16.939
jan 1, 1977
Maximum:
38.154
jan 1, 2008
At the date of observation
Value
Absolute change
Change from previous value
jan 1, 1976
17.243
+17.243
0.0%
jan 1, 1977
16.939
-0.304
-1.76%
jan 1, 1978
18.357
+1.418
8.37%
jan 1, 1979
19.744
+1.387
7.56%
jan 1, 1980
19.836
+0.092
0.47%
jan 1, 1981
17.043
-2.793
-14.08%
jan 1, 1982
20.527
+3.484
20.44%
jan 1, 1983
20.99
+0.463
2.25%
jan 1, 1984
19.967
-1.023
-4.87%
jan 1, 1985
21.095
+1.129
5.65%
jan 1, 1986
21.353
+0.258
1.22%
jan 1, 1987
21.552
+0.198
0.93%
jan 1, 1988
21.643
+0.092
0.42%
jan 1, 1989
21.802
+0.159
0.73%
jan 1, 1990
21.965
+0.164
0.75%
jan 1, 1991
22.465
+0.5
2.27%
jan 1, 1992
22.54
+0.075
0.33%
jan 1, 1993
23.487
+0.947
4.2%
jan 1, 1994
21.666
-1.821
-7.75%
jan 1, 1995
23.825
+2.159
9.97%
jan 1, 1996
24.998
+1.173
4.92%
jan 1, 1997
22.136
-2.862
-11.45%
jan 1, 1998
24.757
+2.621
11.84%
jan 1, 1999
23.339
-1.418
-5.73%
jan 1, 2000
25.81
+2.471
10.59%
jan 1, 2001
24.685
-1.125
-4.36%
jan 1, 2002
26.2
+1.515
6.14%
jan 1, 2003
26.593
+0.393
1.5%
jan 1, 2004
28.135
+1.542
5.8%
jan 1, 2005
31.752
+3.617
12.86%
jan 1, 2006
32.468
+0.716
2.26%
jan 1, 2007
33.138
+0.67
2.06%
jan 1, 2008
38.154
+5.016
15.14%
jan 1, 2009
33.482
-4.672
-12.24%
jan 1, 2010
35.654
+2.172
6.49%
jan 1, 2011
36.212
+0.558
1.56%
jan 1, 2012
33.598
-2.614
-7.22%
jan 1, 2013
32.674
-0.924
-2.75%
jan 1, 2014
32.587
-0.088
-0.27%
jan 1, 2015
32.126
-0.461
-1.41%
jan 1, 2016
30.836
-1.29
-4.02%
Ranking of countries by current statistics by years


Comments: