29
/
en
AIzaSyAYiBZKx7MnpbEhh9jyipgxe19OcubqV5w
April 1, 2024
148011
Guyana
GUY
true
2
1
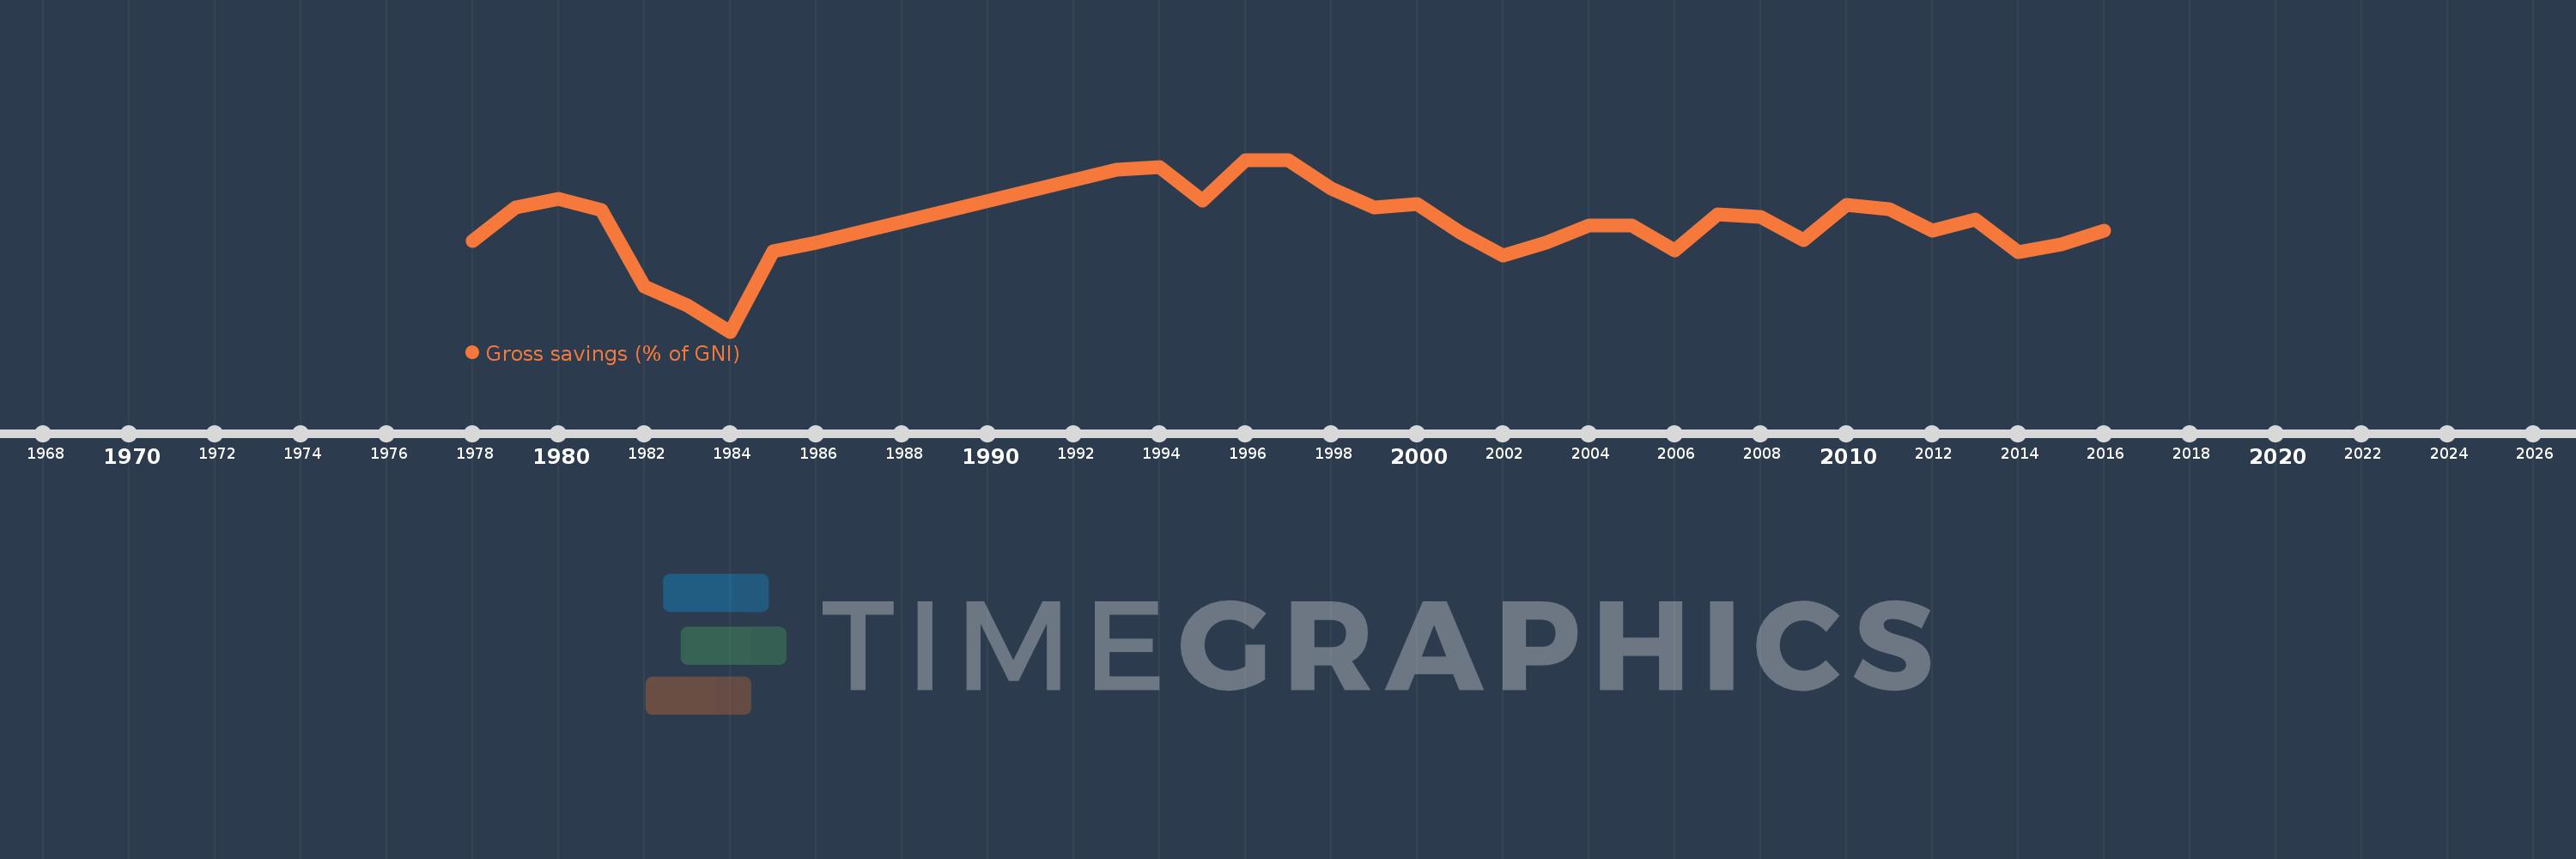
Gross savings (% of GNI)
2016,2015,2014,2013,2012,2011,2010,2009,2008,2007,2006,2005,2004,2003,2002,2001,2000,1999,1998,1997,1996,1995,1994,1993,1986,1985,1984,1983,1982,1981,1980,1979,1978
This statistics in other country:
AfghanistanAlbaniaAlgeriaAngolaAntigua and BarbudaArab WorldArgentinaArmeniaAustraliaAustriaAzerbaijanBahamas, TheBahrainBangladeshBarbadosBelarusBelgiumBelizeBeninBermudaBhutanBoliviaBosnia and HerzegovinaBotswanaBrazilBrunei DarussalamBulgariaBurkina FasoBurundiCabo VerdeCambodiaCameroonCanadaCaribbean small statesCentral African RepublicCentral Europe and the BalticsChadChileChinaColombiaComorosCongo, Dem. Rep.Congo, Rep.Costa RicaCote d'IvoireCroatiaCyprusCzech RepublicDenmarkDjiboutiDominicaDominican RepublicEarly-demographic dividendEast Asia & PacificEast Asia & Pacific (excluding high income)East Asia & Pacific (IDA & IBRD countries)EcuadorEgypt, Arab Rep.El SalvadorEquatorial GuineaEritreaEstoniaEthiopiaEuro areaEurope & Central AsiaEurope & Central Asia (excluding high income)Europe & Central Asia (IDA & IBRD countries)European UnionFaroe IslandsFijiFinlandFragile and conflict affected situationsFranceGabonGambia, TheGeorgiaGermanyGhanaGreeceGrenadaGuatemalaGuineaGuinea-BissauGuyanaHaitiHeavily indebted poor countries (HIPC)High incomeHondurasHong Kong SAR, ChinaHungaryIBRD onlyIcelandIDA & IBRD totalIDA blendIDA onlyIDA totalIndiaIndonesiaIran, Islamic Rep.IraqIrelandIsraelItalyJamaicaJapanJordanKazakhstanKenyaKiribatiKorea, Rep.KosovoKuwaitKyrgyz RepublicLao PDRLate-demographic dividendLatin America & Caribbean Latin America & Caribbean (excluding high income)Latin America & the Caribbean (IDA & IBRD countries)LatviaLeast developed countries: UN classificationLebanonLesothoLiberiaLibyaLithuaniaLow & middle incomeLow incomeLower middle incomeLuxembourgMacao SAR, ChinaMacedonia, FYRMadagascarMalawiMalaysiaMaldivesMaliMaltaMauritaniaMauritiusMexicoMiddle East & North AfricaMiddle East & North Africa (excluding high income)Middle East & North Africa (IDA & IBRD countries)Middle incomeMoldovaMongoliaMontenegroMoroccoMozambiqueNamibiaNepalNetherlandsNew ZealandNicaraguaNigerNigeriaNorth AmericaNorwayOECD membersOmanOther small statesPacific island small statesPakistanPanamaPapua New GuineaParaguayPeruPhilippinesPolandPortugalPost-demographic dividendPre-demographic dividendQatarRomaniaRussian FederationRwandaSaudi ArabiaSenegalSerbiaSeychellesSierra LeoneSingaporeSlovak RepublicSloveniaSmall statesSolomon IslandsSouth AfricaSouth AsiaSouth Asia (IDA & IBRD)South SudanSpainSri LankaSt. Kitts and NevisSt. LuciaSt. Vincent and the GrenadinesSub-Saharan Africa Sub-Saharan Africa (excluding high income)Sub-Saharan Africa (IDA & IBRD countries)SudanSurinameSwazilandSwedenSwitzerlandSyrian Arab RepublicTajikistanTanzaniaThailandTimor-LesteTogoTongaTrinidad and TobagoTunisiaTurkeyUgandaUkraineUnited KingdomUnited StatesUpper middle incomeUruguayVanuatuVenezuela, RBVietnamWest Bank and GazaWorldYemen, Rep.ZambiaZimbabwe Timeline:
This timeline shows a graph from 1978 to 2016 of Guyana. No data until 1977. Number of actual observations by date: 33.
Source name:
World Development Indicators
Source organization:
World Bank national accounts data, and OECD National Accounts data files.
Categories, topics:
Economy & Growth
Last updated:
apr 23, 2017
Indicators value changes by year
Minimum:
-13.701
jan 1, 1984
Maximum:
25.817
jan 1, 1996
At the date of observation
Value
Absolute change
Change from previous value
jan 1, 1978
7.092
+7.092
0.0%
jan 1, 1979
14.88
+7.788
109.82%
jan 1, 1980
16.812
+1.932
12.98%
jan 1, 1981
14.308
-2.504
-14.89%
jan 1, 1982
-3.305
-17.612
-123.1%
jan 1, 1983
-7.733
-4.428
134.01%
jan 1, 1984
-13.701
-5.969
77.18%
jan 1, 1985
4.767
+18.468
-134.79%
jan 1, 1986
6.74
+1.973
41.39%
jan 1, 1993
23.642
+16.901
250.76%
jan 1, 1994
24.083
+0.442
1.87%
jan 1, 1995
16.526
-7.558
-31.38%
jan 1, 1996
25.817
+9.292
56.23%
jan 1, 1997
25.783
-0.034
-0.13%
jan 1, 1998
19.196
-6.588
-25.55%
jan 1, 1999
14.796
-4.399
-22.92%
jan 1, 2000
15.696
+0.9
6.08%
jan 1, 2001
9.117
-6.579
-41.92%
jan 1, 2002
3.781
-5.336
-58.53%
jan 1, 2003
6.674
+2.893
76.52%
jan 1, 2004
10.725
+4.051
60.69%
jan 1, 2005
10.622
-0.103
-0.96%
jan 1, 2006
4.921
-5.701
-53.67%
jan 1, 2007
13.287
+8.365
169.98%
jan 1, 2008
12.67
-0.617
-4.64%
jan 1, 2009
7.34
-5.33
-42.07%
jan 1, 2010
15.354
+8.014
109.18%
jan 1, 2011
14.396
-0.958
-6.24%
jan 1, 2012
9.53
-4.867
-33.8%
jan 1, 2013
11.993
+2.463
25.84%
jan 1, 2014
4.636
-7.356
-61.34%
jan 1, 2015
6.259
+1.622
34.99%
jan 1, 2016
9.43
+3.171
50.66%
Ranking of countries by current statistics by years


Comments: