29
/
en
AIzaSyAYiBZKx7MnpbEhh9jyipgxe19OcubqV5w
April 1, 2024
132066
Fiji
FJI
true
2
1
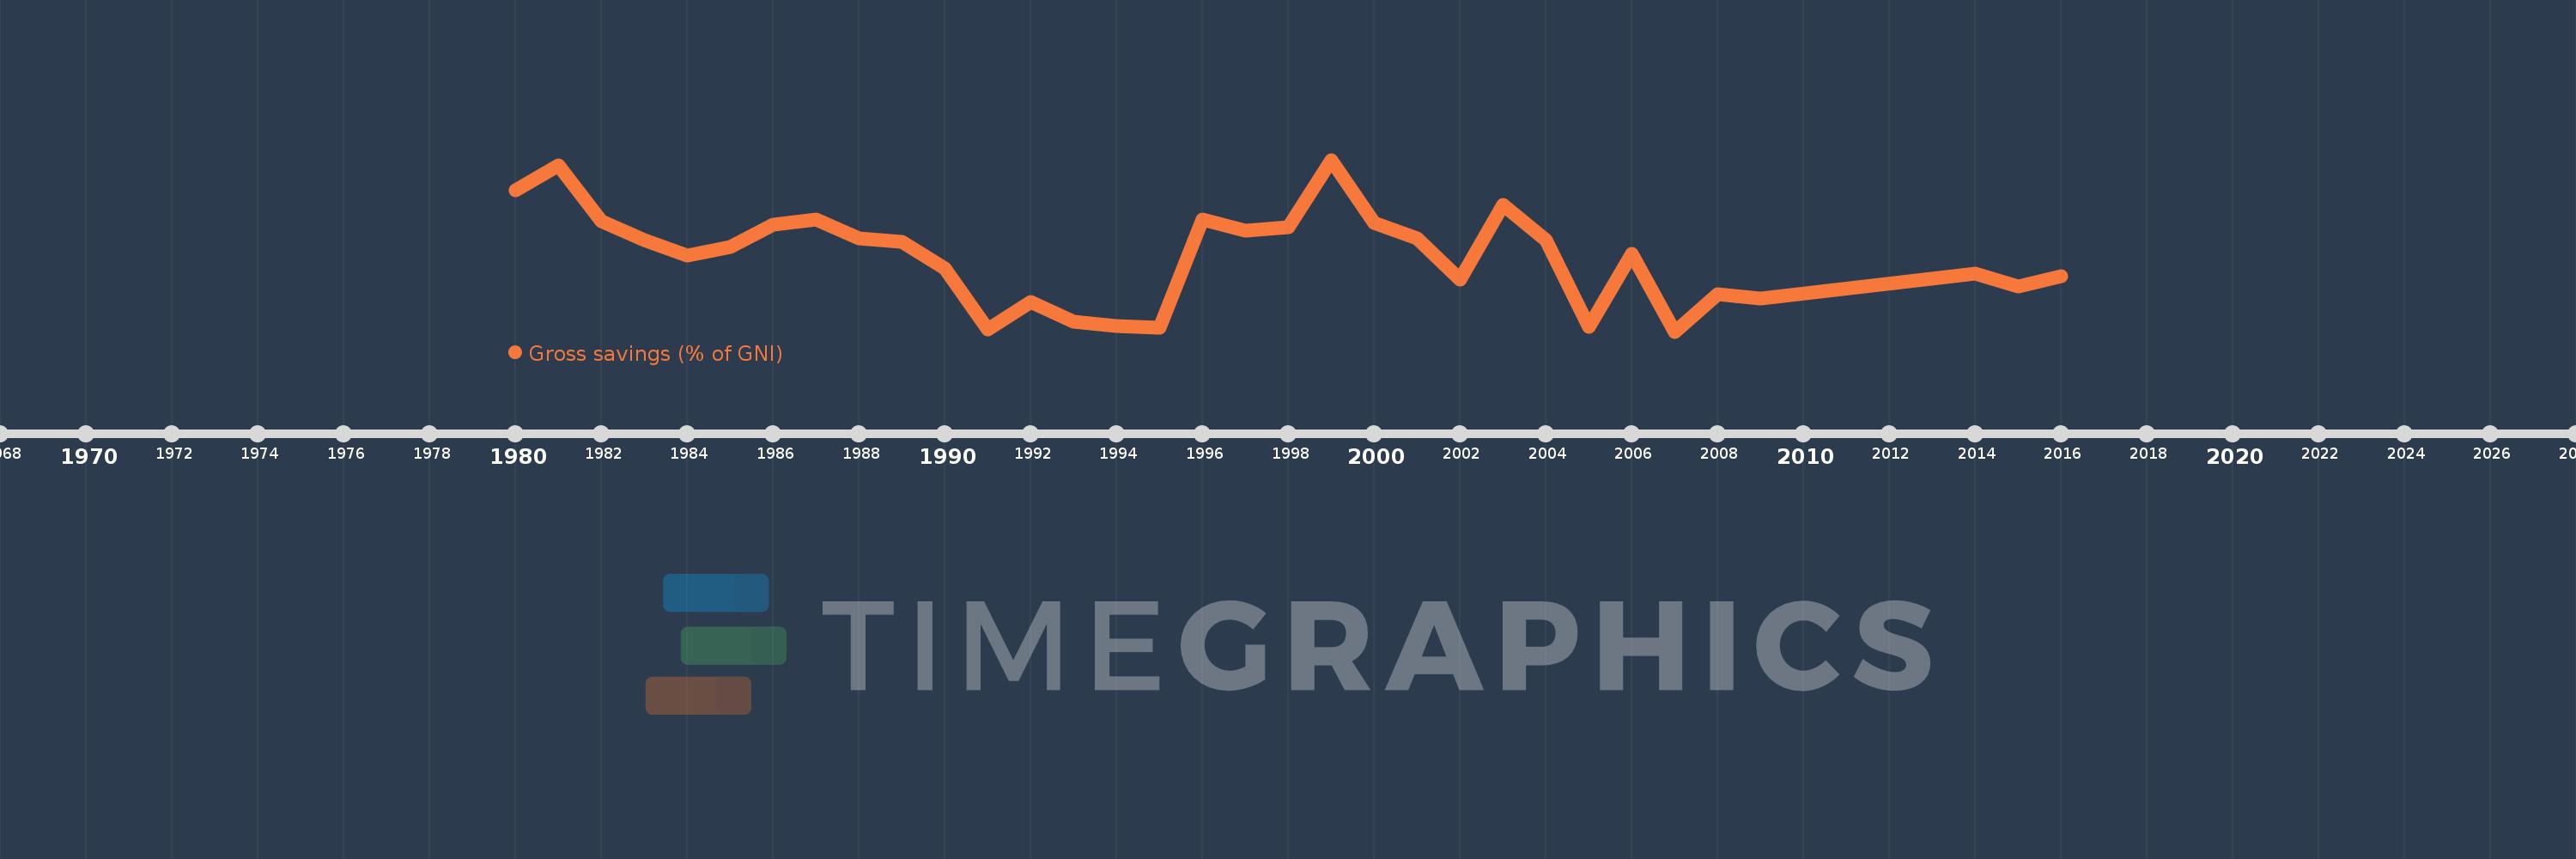
Gross savings (% of GNI)
2016,2015,2014,2009,2008,2007,2006,2005,2004,2003,2002,2001,2000,1999,1998,1997,1996,1995,1994,1993,1992,1991,1990,1989,1988,1987,1986,1985,1984,1983,1982,1981,1980
This statistics in other country:
AfghanistanAlbaniaAlgeriaAngolaAntigua and BarbudaArab WorldArgentinaArmeniaAustraliaAustriaAzerbaijanBahamas, TheBahrainBangladeshBarbadosBelarusBelgiumBelizeBeninBermudaBhutanBoliviaBosnia and HerzegovinaBotswanaBrazilBrunei DarussalamBulgariaBurkina FasoBurundiCabo VerdeCambodiaCameroonCanadaCaribbean small statesCentral African RepublicCentral Europe and the BalticsChadChileChinaColombiaComorosCongo, Dem. Rep.Congo, Rep.Costa RicaCote d'IvoireCroatiaCyprusCzech RepublicDenmarkDjiboutiDominicaDominican RepublicEarly-demographic dividendEast Asia & PacificEast Asia & Pacific (excluding high income)East Asia & Pacific (IDA & IBRD countries)EcuadorEgypt, Arab Rep.El SalvadorEquatorial GuineaEritreaEstoniaEthiopiaEuro areaEurope & Central AsiaEurope & Central Asia (excluding high income)Europe & Central Asia (IDA & IBRD countries)European UnionFaroe IslandsFijiFinlandFragile and conflict affected situationsFranceGabonGambia, TheGeorgiaGermanyGhanaGreeceGrenadaGuatemalaGuineaGuinea-BissauGuyanaHaitiHeavily indebted poor countries (HIPC)High incomeHondurasHong Kong SAR, ChinaHungaryIBRD onlyIcelandIDA & IBRD totalIDA blendIDA onlyIDA totalIndiaIndonesiaIran, Islamic Rep.IraqIrelandIsraelItalyJamaicaJapanJordanKazakhstanKenyaKiribatiKorea, Rep.KosovoKuwaitKyrgyz RepublicLao PDRLate-demographic dividendLatin America & Caribbean Latin America & Caribbean (excluding high income)Latin America & the Caribbean (IDA & IBRD countries)LatviaLeast developed countries: UN classificationLebanonLesothoLiberiaLibyaLithuaniaLow & middle incomeLow incomeLower middle incomeLuxembourgMacao SAR, ChinaMacedonia, FYRMadagascarMalawiMalaysiaMaldivesMaliMaltaMauritaniaMauritiusMexicoMiddle East & North AfricaMiddle East & North Africa (excluding high income)Middle East & North Africa (IDA & IBRD countries)Middle incomeMoldovaMongoliaMontenegroMoroccoMozambiqueNamibiaNepalNetherlandsNew ZealandNicaraguaNigerNigeriaNorth AmericaNorwayOECD membersOmanOther small statesPacific island small statesPakistanPanamaPapua New GuineaParaguayPeruPhilippinesPolandPortugalPost-demographic dividendPre-demographic dividendQatarRomaniaRussian FederationRwandaSaudi ArabiaSenegalSerbiaSeychellesSierra LeoneSingaporeSlovak RepublicSloveniaSmall statesSolomon IslandsSouth AfricaSouth AsiaSouth Asia (IDA & IBRD)South SudanSpainSri LankaSt. Kitts and NevisSt. LuciaSt. Vincent and the GrenadinesSub-Saharan Africa Sub-Saharan Africa (excluding high income)Sub-Saharan Africa (IDA & IBRD countries)SudanSurinameSwazilandSwedenSwitzerlandSyrian Arab RepublicTajikistanTanzaniaThailandTimor-LesteTogoTongaTrinidad and TobagoTunisiaTurkeyUgandaUkraineUnited KingdomUnited StatesUpper middle incomeUruguayVanuatuVenezuela, RBVietnamWest Bank and GazaWorldYemen, Rep.ZambiaZimbabwe Timeline:
This timeline shows a graph from 1980 to 2016 of Fiji. No data until 1979. Number of actual observations by date: 33.
Source name:
World Development Indicators
Source organization:
World Bank national accounts data, and OECD National Accounts data files.
Categories, topics:
Economy & Growth
Last updated:
apr 23, 2017
Indicators value changes by year
At the date of observation
Value
Absolute change
Change from previous value
jan 1, 1980
25.879
+25.879
0.0%
jan 1, 1981
29.34
+3.461
13.37%
jan 1, 1982
21.442
-7.897
-26.92%
jan 1, 1983
18.742
-2.7
-12.59%
jan 1, 1984
16.521
-2.221
-11.85%
jan 1, 1985
17.731
+1.21
7.32%
jan 1, 1986
20.934
+3.203
18.07%
jan 1, 1987
21.675
+0.741
3.54%
jan 1, 1988
18.96
-2.715
-12.53%
jan 1, 1989
18.576
-0.383
-2.02%
jan 1, 1990
14.782
-3.794
-20.42%
jan 1, 1991
6.032
-8.75
-59.19%
jan 1, 1992
9.987
+3.955
65.56%
jan 1, 1993
7.103
-2.884
-28.88%
jan 1, 1994
6.543
-0.561
-7.9%
jan 1, 1995
6.288
-0.255
-3.9%
jan 1, 1996
21.685
+15.397
244.89%
jan 1, 1997
20.103
-1.582
-7.29%
jan 1, 1998
20.65
+0.547
2.72%
jan 1, 1999
30.18
+9.53
46.15%
jan 1, 2000
21.225
-8.956
-29.67%
jan 1, 2001
18.965
-2.26
-10.65%
jan 1, 2002
13.119
-5.846
-30.82%
jan 1, 2003
23.733
+10.613
80.9%
jan 1, 2004
18.759
-4.974
-20.96%
jan 1, 2005
6.46
-12.298
-65.56%
jan 1, 2006
16.868
+10.408
161.11%
jan 1, 2007
5.755
-11.114
-65.88%
jan 1, 2008
11.105
+5.35
92.97%
jan 1, 2009
10.457
-0.648
-5.84%
jan 1, 2014
13.944
+3.487
33.35%
jan 1, 2015
12.108
-1.836
-13.17%
jan 1, 2016
13.677
+1.569
12.96%
Ranking of countries by current statistics by years


Comments: