29
/
en
AIzaSyAYiBZKx7MnpbEhh9jyipgxe19OcubqV5w
April 1, 2024
68874
Antigua and Barbuda
ATG
true
2
1
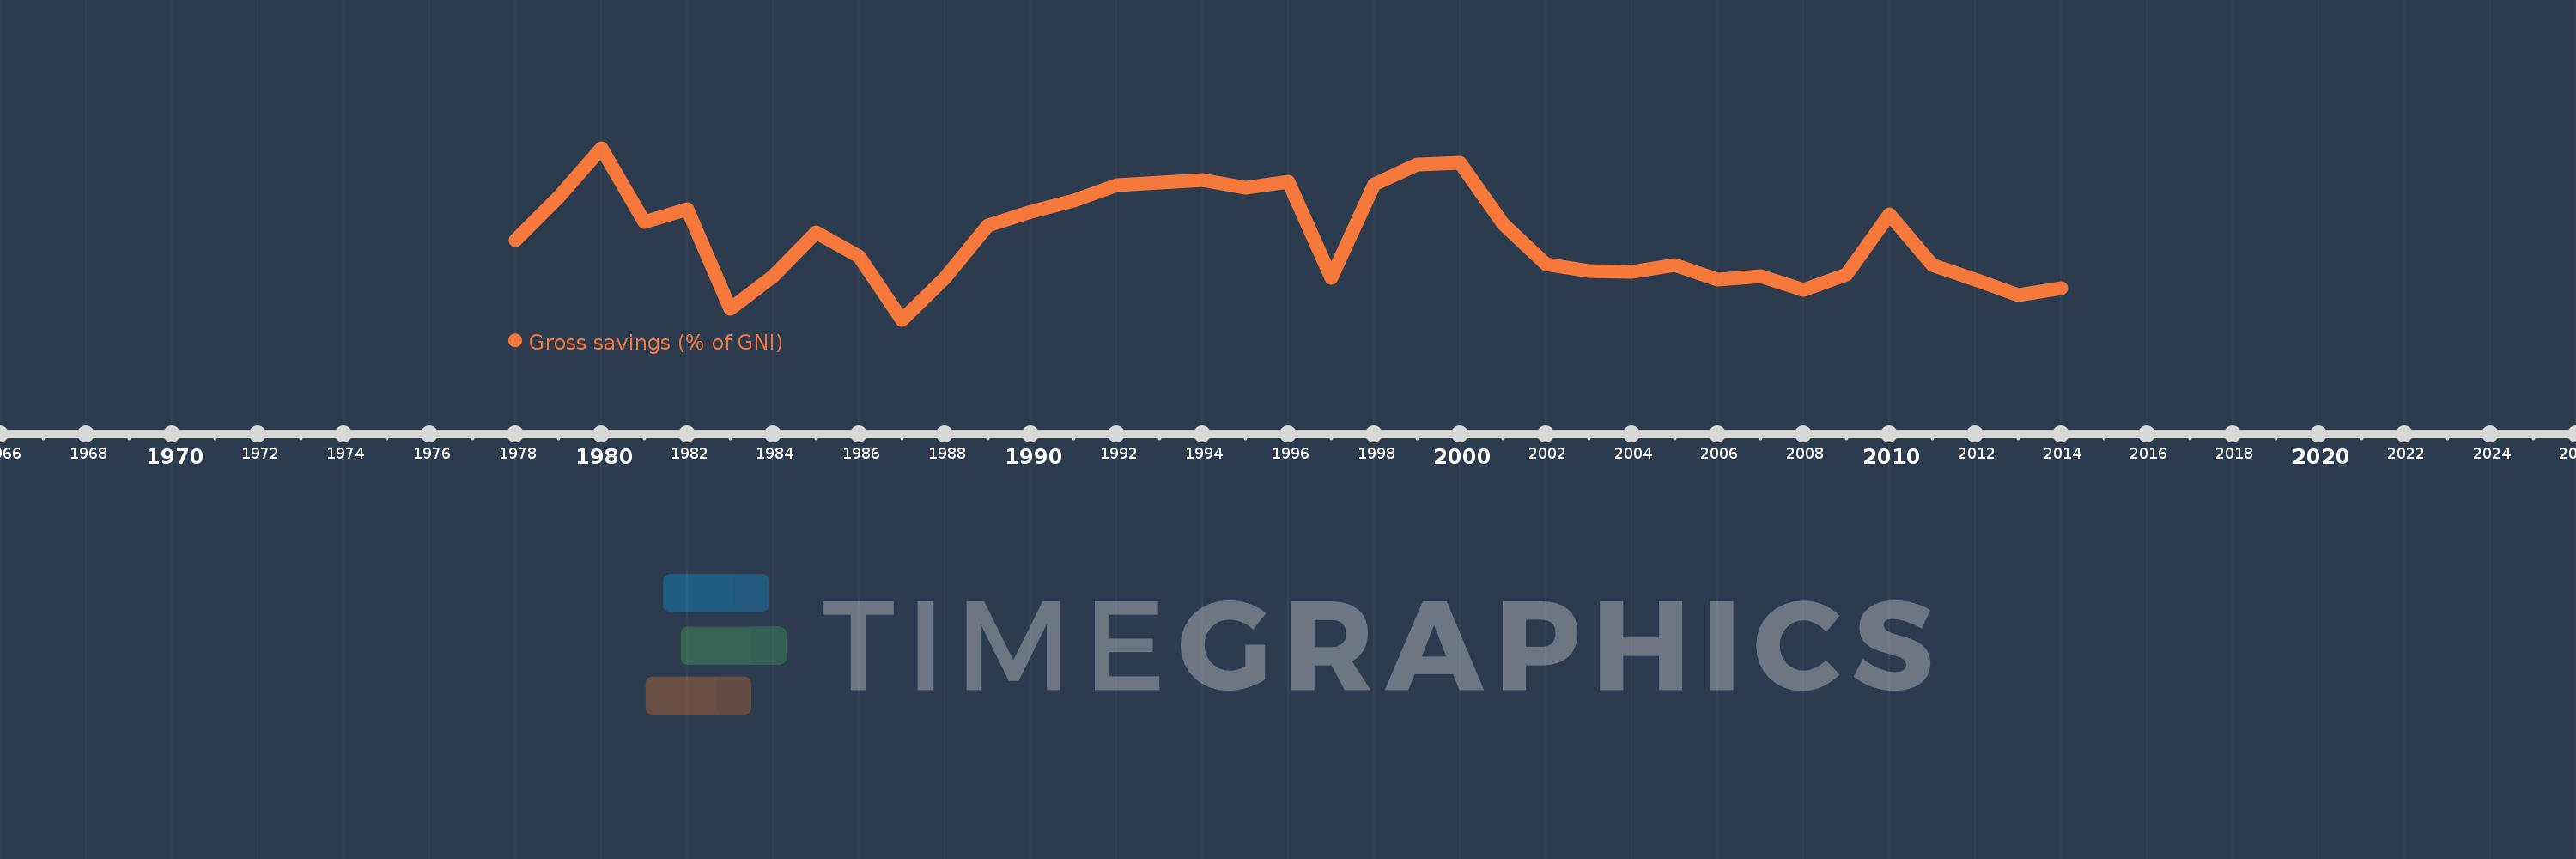
Gross savings (% of GNI)
2014,2013,2012,2011,2010,2009,2008,2007,2006,2005,2004,2003,2002,2001,2000,1999,1998,1997,1996,1995,1994,1993,1992,1991,1990,1989,1988,1987,1986,1985,1984,1983,1982,1981,1980,1979,1978
This statistics in other country:
AfghanistanAlbaniaAlgeriaAngolaAntigua and BarbudaArab WorldArgentinaArmeniaAustraliaAustriaAzerbaijanBahamas, TheBahrainBangladeshBarbadosBelarusBelgiumBelizeBeninBermudaBhutanBoliviaBosnia and HerzegovinaBotswanaBrazilBrunei DarussalamBulgariaBurkina FasoBurundiCabo VerdeCambodiaCameroonCanadaCaribbean small statesCentral African RepublicCentral Europe and the BalticsChadChileChinaColombiaComorosCongo, Dem. Rep.Congo, Rep.Costa RicaCote d'IvoireCroatiaCyprusCzech RepublicDenmarkDjiboutiDominicaDominican RepublicEarly-demographic dividendEast Asia & PacificEast Asia & Pacific (excluding high income)East Asia & Pacific (IDA & IBRD countries)EcuadorEgypt, Arab Rep.El SalvadorEquatorial GuineaEritreaEstoniaEthiopiaEuro areaEurope & Central AsiaEurope & Central Asia (excluding high income)Europe & Central Asia (IDA & IBRD countries)European UnionFaroe IslandsFijiFinlandFragile and conflict affected situationsFranceGabonGambia, TheGeorgiaGermanyGhanaGreeceGrenadaGuatemalaGuineaGuinea-BissauGuyanaHaitiHeavily indebted poor countries (HIPC)High incomeHondurasHong Kong SAR, ChinaHungaryIBRD onlyIcelandIDA & IBRD totalIDA blendIDA onlyIDA totalIndiaIndonesiaIran, Islamic Rep.IraqIrelandIsraelItalyJamaicaJapanJordanKazakhstanKenyaKiribatiKorea, Rep.KosovoKuwaitKyrgyz RepublicLao PDRLate-demographic dividendLatin America & Caribbean Latin America & Caribbean (excluding high income)Latin America & the Caribbean (IDA & IBRD countries)LatviaLeast developed countries: UN classificationLebanonLesothoLiberiaLibyaLithuaniaLow & middle incomeLow incomeLower middle incomeLuxembourgMacao SAR, ChinaMacedonia, FYRMadagascarMalawiMalaysiaMaldivesMaliMaltaMauritaniaMauritiusMexicoMiddle East & North AfricaMiddle East & North Africa (excluding high income)Middle East & North Africa (IDA & IBRD countries)Middle incomeMoldovaMongoliaMontenegroMoroccoMozambiqueNamibiaNepalNetherlandsNew ZealandNicaraguaNigerNigeriaNorth AmericaNorwayOECD membersOmanOther small statesPacific island small statesPakistanPanamaPapua New GuineaParaguayPeruPhilippinesPolandPortugalPost-demographic dividendPre-demographic dividendQatarRomaniaRussian FederationRwandaSaudi ArabiaSenegalSerbiaSeychellesSierra LeoneSingaporeSlovak RepublicSloveniaSmall statesSolomon IslandsSouth AfricaSouth AsiaSouth Asia (IDA & IBRD)South SudanSpainSri LankaSt. Kitts and NevisSt. LuciaSt. Vincent and the GrenadinesSub-Saharan Africa Sub-Saharan Africa (excluding high income)Sub-Saharan Africa (IDA & IBRD countries)SudanSurinameSwazilandSwedenSwitzerlandSyrian Arab RepublicTajikistanTanzaniaThailandTimor-LesteTogoTongaTrinidad and TobagoTunisiaTurkeyUgandaUkraineUnited KingdomUnited StatesUpper middle incomeUruguayVanuatuVenezuela, RBVietnamWest Bank and GazaWorldYemen, Rep.ZambiaZimbabwe Timeline:
This timeline shows a graph from 1978 to 2014 of Antigua and Barbuda. No data until 1977. Number of actual observations by date: 37.
Source name:
World Development Indicators
Source organization:
World Bank national accounts data, and OECD National Accounts data files.
Categories, topics:
Economy & Growth
Last updated:
apr 23, 2017
Indicators value changes by year
Maximum:
40.411
jan 1, 1980
At the date of observation
Value
Absolute change
Change from previous value
jan 1, 1978
19.708
+19.708
0.0%
jan 1, 1979
29.418
+9.711
49.27%
jan 1, 1980
40.411
+10.993
37.37%
jan 1, 1981
23.767
-16.644
-41.19%
jan 1, 1982
26.762
+2.996
12.6%
jan 1, 1983
4.375
-22.387
-83.65%
jan 1, 1984
11.658
+7.283
166.45%
jan 1, 1985
21.525
+9.867
84.64%
jan 1, 1986
16.123
-5.402
-25.1%
jan 1, 1987
1.874
-14.249
-88.38%
jan 1, 1988
11.281
+9.407
501.97%
jan 1, 1989
22.942
+11.661
103.38%
jan 1, 1990
26.011
+3.069
13.38%
jan 1, 1991
28.614
+2.603
10.01%
jan 1, 1992
31.983
+3.37
11.78%
jan 1, 1993
32.614
+0.63
1.97%
jan 1, 1994
33.256
+0.642
1.97%
jan 1, 1995
31.44
-1.816
-5.46%
jan 1, 1996
32.934
+1.494
4.75%
jan 1, 1997
11.195
-21.739
-66.01%
jan 1, 1998
32.322
+21.127
188.72%
jan 1, 1999
36.75
+4.428
13.7%
jan 1, 2000
37.171
+0.421
1.15%
jan 1, 2001
23.368
-13.804
-37.14%
jan 1, 2002
14.308
-9.06
-38.77%
jan 1, 2003
12.855
-1.453
-10.15%
jan 1, 2004
12.614
-0.242
-1.88%
jan 1, 2005
14.195
+1.581
12.54%
jan 1, 2006
10.861
-3.334
-23.49%
jan 1, 2007
11.679
+0.818
7.53%
jan 1, 2008
8.466
-3.213
-27.51%
jan 1, 2009
11.939
+3.473
41.02%
jan 1, 2010
25.437
+13.499
113.07%
jan 1, 2011
14.118
-11.319
-44.5%
jan 1, 2012
10.87
-3.249
-23.01%
jan 1, 2013
7.454
-3.415
-31.42%
jan 1, 2014
8.944
+1.489
19.98%
Ranking of countries by current statistics by years


Comments: