29
/
en
AIzaSyAYiBZKx7MnpbEhh9jyipgxe19OcubqV5w
April 1, 2024
76238
Bahamas, The
BHS
true
2
1
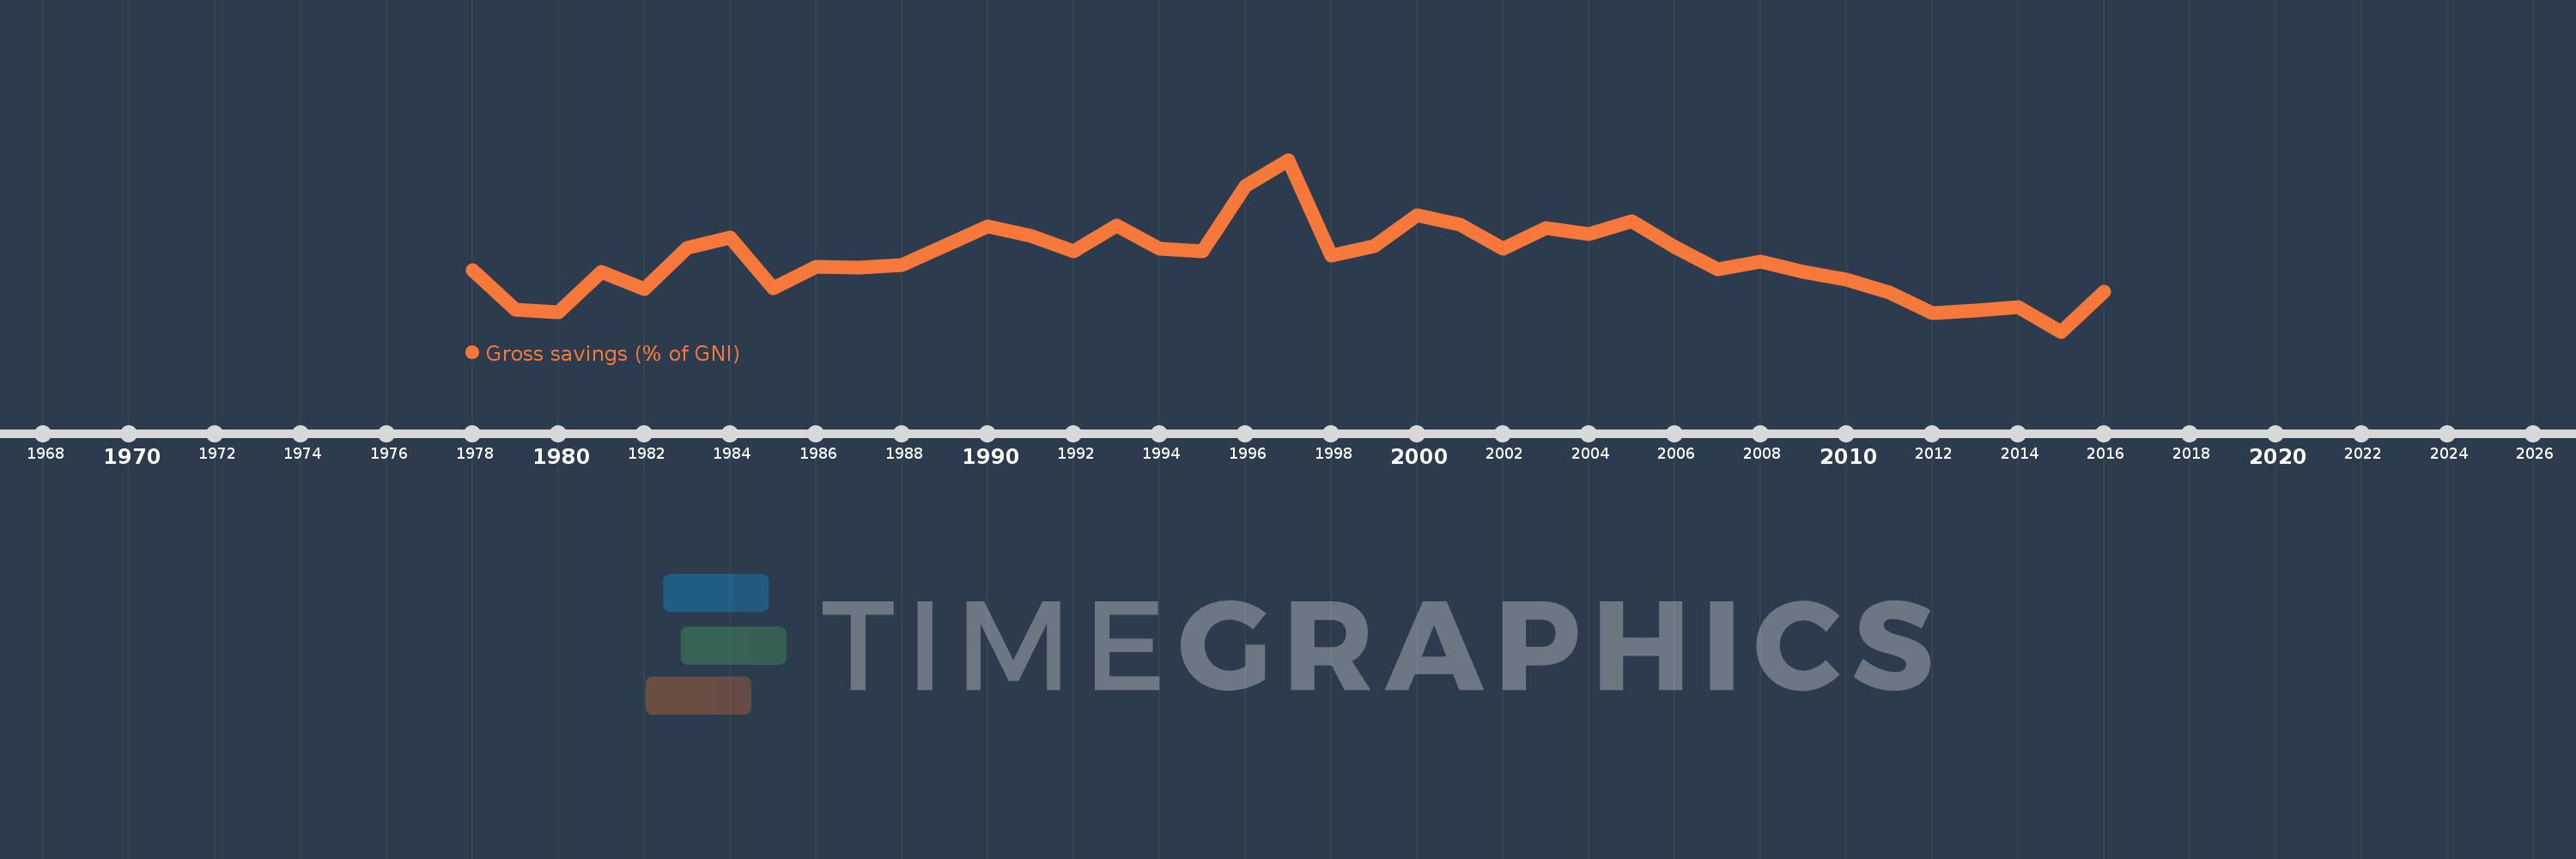
Gross savings (% of GNI)
2016,2015,2014,2013,2012,2011,2010,2009,2008,2007,2006,2005,2004,2003,2002,2001,2000,1999,1998,1997,1996,1995,1994,1993,1992,1991,1990,1988,1987,1986,1985,1984,1983,1982,1981,1980,1979,1978
This statistics in other country:
AfghanistanAlbaniaAlgeriaAngolaAntigua and BarbudaArab WorldArgentinaArmeniaAustraliaAustriaAzerbaijanBahamas, TheBahrainBangladeshBarbadosBelarusBelgiumBelizeBeninBermudaBhutanBoliviaBosnia and HerzegovinaBotswanaBrazilBrunei DarussalamBulgariaBurkina FasoBurundiCabo VerdeCambodiaCameroonCanadaCaribbean small statesCentral African RepublicCentral Europe and the BalticsChadChileChinaColombiaComorosCongo, Dem. Rep.Congo, Rep.Costa RicaCote d'IvoireCroatiaCyprusCzech RepublicDenmarkDjiboutiDominicaDominican RepublicEarly-demographic dividendEast Asia & PacificEast Asia & Pacific (excluding high income)East Asia & Pacific (IDA & IBRD countries)EcuadorEgypt, Arab Rep.El SalvadorEquatorial GuineaEritreaEstoniaEthiopiaEuro areaEurope & Central AsiaEurope & Central Asia (excluding high income)Europe & Central Asia (IDA & IBRD countries)European UnionFaroe IslandsFijiFinlandFragile and conflict affected situationsFranceGabonGambia, TheGeorgiaGermanyGhanaGreeceGrenadaGuatemalaGuineaGuinea-BissauGuyanaHaitiHeavily indebted poor countries (HIPC)High incomeHondurasHong Kong SAR, ChinaHungaryIBRD onlyIcelandIDA & IBRD totalIDA blendIDA onlyIDA totalIndiaIndonesiaIran, Islamic Rep.IraqIrelandIsraelItalyJamaicaJapanJordanKazakhstanKenyaKiribatiKorea, Rep.KosovoKuwaitKyrgyz RepublicLao PDRLate-demographic dividendLatin America & Caribbean Latin America & Caribbean (excluding high income)Latin America & the Caribbean (IDA & IBRD countries)LatviaLeast developed countries: UN classificationLebanonLesothoLiberiaLibyaLithuaniaLow & middle incomeLow incomeLower middle incomeLuxembourgMacao SAR, ChinaMacedonia, FYRMadagascarMalawiMalaysiaMaldivesMaliMaltaMauritaniaMauritiusMexicoMiddle East & North AfricaMiddle East & North Africa (excluding high income)Middle East & North Africa (IDA & IBRD countries)Middle incomeMoldovaMongoliaMontenegroMoroccoMozambiqueNamibiaNepalNetherlandsNew ZealandNicaraguaNigerNigeriaNorth AmericaNorwayOECD membersOmanOther small statesPacific island small statesPakistanPanamaPapua New GuineaParaguayPeruPhilippinesPolandPortugalPost-demographic dividendPre-demographic dividendQatarRomaniaRussian FederationRwandaSaudi ArabiaSenegalSerbiaSeychellesSierra LeoneSingaporeSlovak RepublicSloveniaSmall statesSolomon IslandsSouth AfricaSouth AsiaSouth Asia (IDA & IBRD)South SudanSpainSri LankaSt. Kitts and NevisSt. LuciaSt. Vincent and the GrenadinesSub-Saharan Africa Sub-Saharan Africa (excluding high income)Sub-Saharan Africa (IDA & IBRD countries)SudanSurinameSwazilandSwedenSwitzerlandSyrian Arab RepublicTajikistanTanzaniaThailandTimor-LesteTogoTongaTrinidad and TobagoTunisiaTurkeyUgandaUkraineUnited KingdomUnited StatesUpper middle incomeUruguayVanuatuVenezuela, RBVietnamWest Bank and GazaWorldYemen, Rep.ZambiaZimbabwe Timeline:
This timeline shows a graph from 1978 to 2016 of Bahamas, The. No data until 1977. Number of actual observations by date: 38.
Source name:
World Development Indicators
Source organization:
World Bank national accounts data, and OECD National Accounts data files.
Categories, topics:
Economy & Growth
Last updated:
apr 23, 2017
Indicators value changes by year
At the date of observation
Value
Absolute change
Change from previous value
jan 1, 1978
17.938
+17.938
0.0%
jan 1, 1979
11.382
-6.555
-36.55%
jan 1, 1980
10.892
-0.49
-4.3%
jan 1, 1981
17.53
+6.638
60.94%
jan 1, 1982
14.758
-2.772
-15.82%
jan 1, 1983
21.525
+6.767
45.86%
jan 1, 1984
23.321
+1.796
8.34%
jan 1, 1985
14.92
-8.401
-36.02%
jan 1, 1986
18.452
+3.532
23.68%
jan 1, 1987
18.319
-0.134
-0.72%
jan 1, 1988
18.758
+0.439
2.4%
jan 1, 1990
25.138
+6.38
34.01%
jan 1, 1991
23.625
-1.513
-6.02%
jan 1, 1992
20.952
-2.672
-11.31%
jan 1, 1993
25.295
+4.343
20.73%
jan 1, 1994
21.42
-3.876
-15.32%
jan 1, 1995
21.004
-0.416
-1.94%
jan 1, 1996
31.82
+10.816
51.5%
jan 1, 1997
36.12
+4.3
13.51%
jan 1, 1998
20.26
-15.861
-43.91%
jan 1, 1999
21.8
+1.541
7.6%
jan 1, 2000
27.032
+5.232
24.0%
jan 1, 2001
25.339
-1.693
-6.26%
jan 1, 2002
21.481
-3.858
-15.23%
jan 1, 2003
24.849
+3.368
15.68%
jan 1, 2004
23.828
-1.021
-4.11%
jan 1, 2005
25.907
+2.079
8.73%
jan 1, 2006
21.706
-4.201
-16.22%
jan 1, 2007
17.949
-3.757
-17.31%
jan 1, 2008
19.326
+1.376
7.67%
jan 1, 2009
17.602
-1.723
-8.92%
jan 1, 2010
16.306
-1.296
-7.36%
jan 1, 2011
14.143
-2.163
-13.26%
jan 1, 2012
10.842
-3.302
-23.34%
jan 1, 2013
11.262
+0.42
3.88%
jan 1, 2014
11.807
+0.545
4.84%
jan 1, 2015
7.727
-4.079
-34.55%
jan 1, 2016
14.26
+6.533
84.54%
Ranking of countries by current statistics by years


Comments: