29
/
en
AIzaSyAYiBZKx7MnpbEhh9jyipgxe19OcubqV5w
April 1, 2024
150450
Honduras
HND
true
2
1
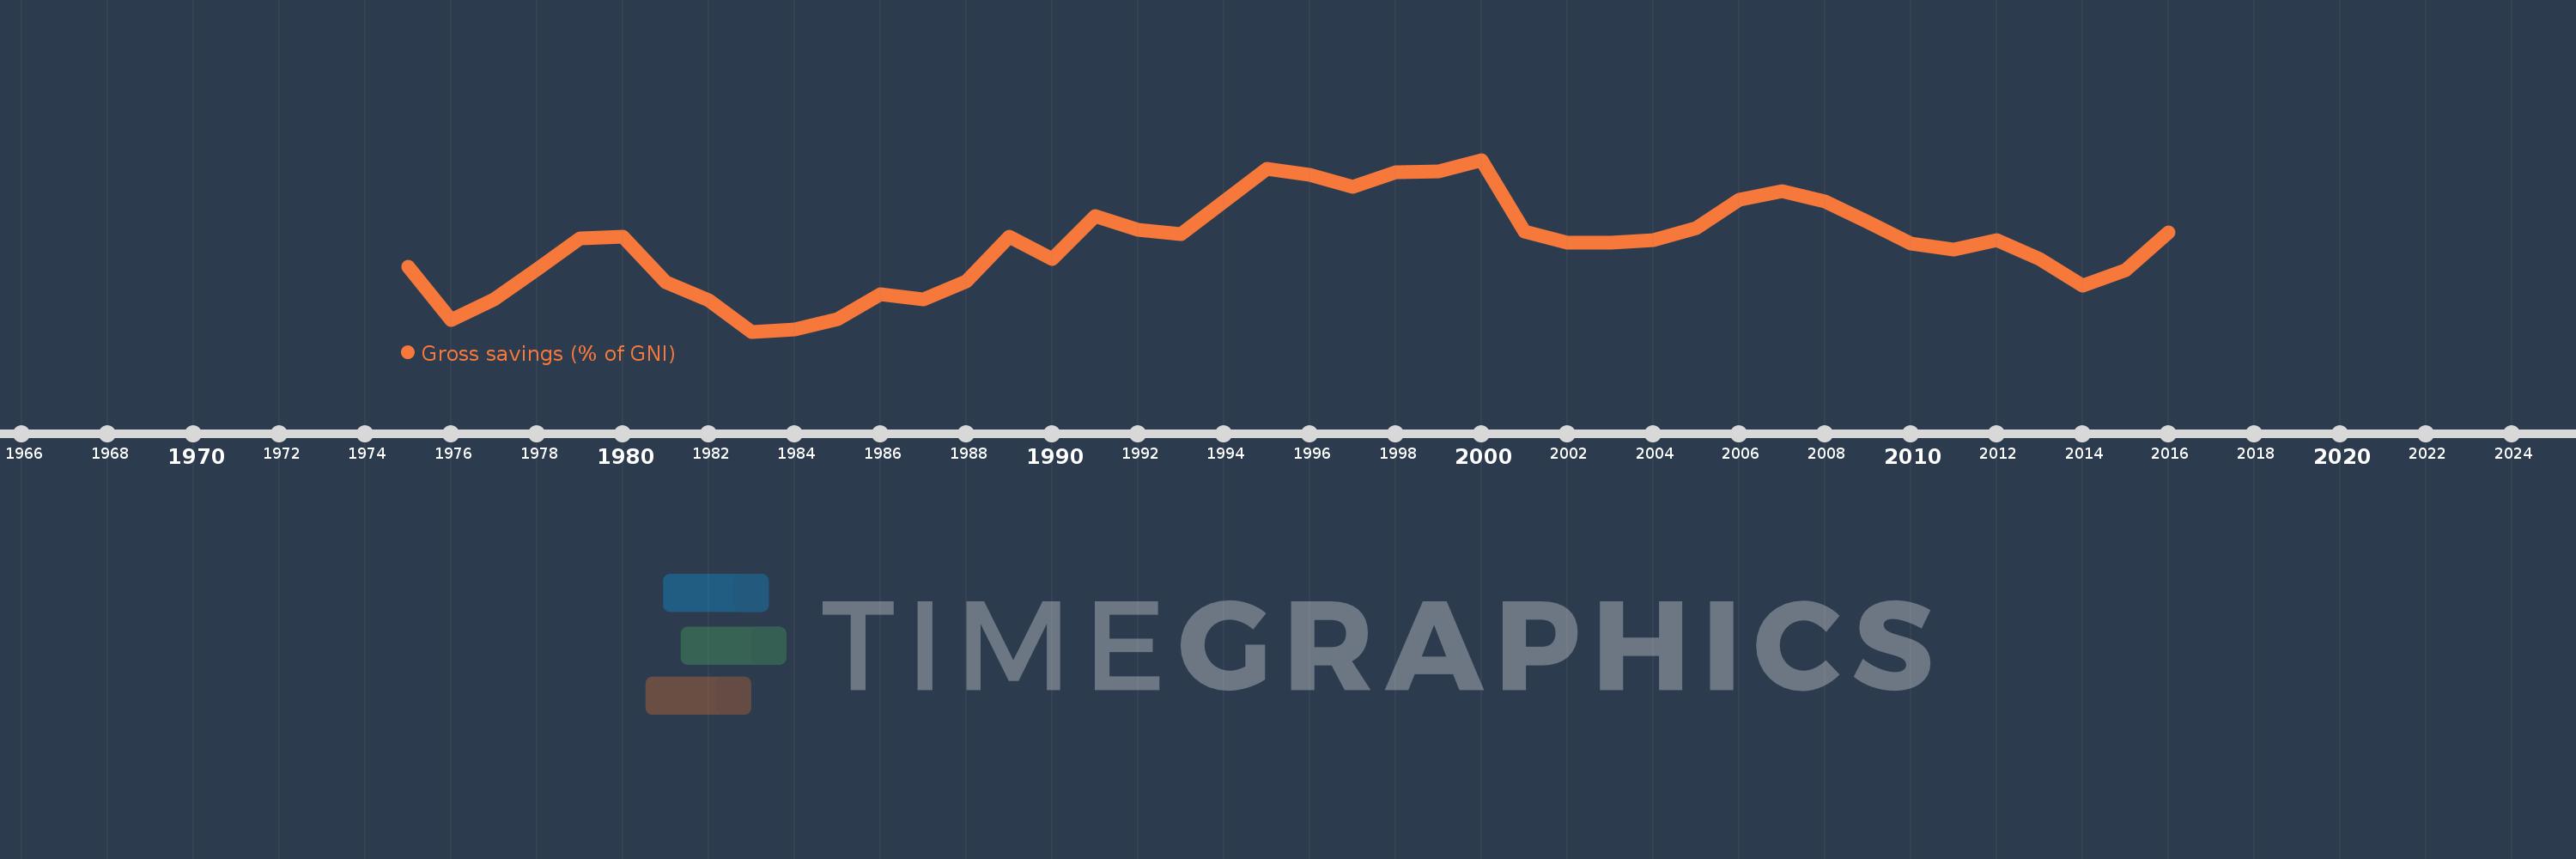
Gross savings (% of GNI)
2016,2015,2014,2013,2012,2011,2010,2009,2008,2007,2006,2005,2004,2003,2002,2001,2000,1999,1998,1997,1996,1995,1994,1993,1992,1991,1990,1989,1988,1987,1986,1985,1984,1983,1982,1981,1980,1979,1978,1977,1976,1975
This statistics in other country:
AfghanistanAlbaniaAlgeriaAngolaAntigua and BarbudaArab WorldArgentinaArmeniaAustraliaAustriaAzerbaijanBahamas, TheBahrainBangladeshBarbadosBelarusBelgiumBelizeBeninBermudaBhutanBoliviaBosnia and HerzegovinaBotswanaBrazilBrunei DarussalamBulgariaBurkina FasoBurundiCabo VerdeCambodiaCameroonCanadaCaribbean small statesCentral African RepublicCentral Europe and the BalticsChadChileChinaColombiaComorosCongo, Dem. Rep.Congo, Rep.Costa RicaCote d'IvoireCroatiaCyprusCzech RepublicDenmarkDjiboutiDominicaDominican RepublicEarly-demographic dividendEast Asia & PacificEast Asia & Pacific (excluding high income)East Asia & Pacific (IDA & IBRD countries)EcuadorEgypt, Arab Rep.El SalvadorEquatorial GuineaEritreaEstoniaEthiopiaEuro areaEurope & Central AsiaEurope & Central Asia (excluding high income)Europe & Central Asia (IDA & IBRD countries)European UnionFaroe IslandsFijiFinlandFragile and conflict affected situationsFranceGabonGambia, TheGeorgiaGermanyGhanaGreeceGrenadaGuatemalaGuineaGuinea-BissauGuyanaHaitiHeavily indebted poor countries (HIPC)High incomeHondurasHong Kong SAR, ChinaHungaryIBRD onlyIcelandIDA & IBRD totalIDA blendIDA onlyIDA totalIndiaIndonesiaIran, Islamic Rep.IraqIrelandIsraelItalyJamaicaJapanJordanKazakhstanKenyaKiribatiKorea, Rep.KosovoKuwaitKyrgyz RepublicLao PDRLate-demographic dividendLatin America & Caribbean Latin America & Caribbean (excluding high income)Latin America & the Caribbean (IDA & IBRD countries)LatviaLeast developed countries: UN classificationLebanonLesothoLiberiaLibyaLithuaniaLow & middle incomeLow incomeLower middle incomeLuxembourgMacao SAR, ChinaMacedonia, FYRMadagascarMalawiMalaysiaMaldivesMaliMaltaMauritaniaMauritiusMexicoMiddle East & North AfricaMiddle East & North Africa (excluding high income)Middle East & North Africa (IDA & IBRD countries)Middle incomeMoldovaMongoliaMontenegroMoroccoMozambiqueNamibiaNepalNetherlandsNew ZealandNicaraguaNigerNigeriaNorth AmericaNorwayOECD membersOmanOther small statesPacific island small statesPakistanPanamaPapua New GuineaParaguayPeruPhilippinesPolandPortugalPost-demographic dividendPre-demographic dividendQatarRomaniaRussian FederationRwandaSaudi ArabiaSenegalSerbiaSeychellesSierra LeoneSingaporeSlovak RepublicSloveniaSmall statesSolomon IslandsSouth AfricaSouth AsiaSouth Asia (IDA & IBRD)South SudanSpainSri LankaSt. Kitts and NevisSt. LuciaSt. Vincent and the GrenadinesSub-Saharan Africa Sub-Saharan Africa (excluding high income)Sub-Saharan Africa (IDA & IBRD countries)SudanSurinameSwazilandSwedenSwitzerlandSyrian Arab RepublicTajikistanTanzaniaThailandTimor-LesteTogoTongaTrinidad and TobagoTunisiaTurkeyUgandaUkraineUnited KingdomUnited StatesUpper middle incomeUruguayVanuatuVenezuela, RBVietnamWest Bank and GazaWorldYemen, Rep.ZambiaZimbabwe Timeline:
This timeline shows a graph from 1975 to 2016 of Honduras. No data until 1974. Number of actual observations by date: 42.
Source name:
World Development Indicators
Source organization:
World Bank national accounts data, and OECD National Accounts data files.
Categories, topics:
Economy & Growth
Last updated:
apr 23, 2017
Indicators value changes by year
Maximum:
30.558
jan 1, 2000
At the date of observation
Value
Absolute change
Change from previous value
jan 1, 1975
16.312
+16.312
0.0%
jan 1, 1976
9.196
-7.116
-43.62%
jan 1, 1977
11.957
+2.761
30.02%
jan 1, 1978
16.001
+4.044
33.82%
jan 1, 1979
20.086
+4.085
25.53%
jan 1, 1980
20.287
+0.2
1.0%
jan 1, 1981
14.186
-6.101
-30.07%
jan 1, 1982
11.769
-2.417
-17.04%
jan 1, 1983
7.636
-4.134
-35.12%
jan 1, 1984
7.973
+0.337
4.42%
jan 1, 1985
9.289
+1.316
16.51%
jan 1, 1986
12.657
+3.368
36.26%
jan 1, 1987
11.99
-0.667
-5.27%
jan 1, 1988
14.338
+2.348
19.58%
jan 1, 1989
20.264
+5.925
41.32%
jan 1, 1990
17.367
-2.896
-14.29%
jan 1, 1991
23.049
+5.682
32.72%
jan 1, 1992
21.234
-1.815
-7.87%
jan 1, 1993
20.622
-0.613
-2.89%
jan 1, 1994
24.989
+4.367
21.18%
jan 1, 1995
29.31
+4.321
17.29%
jan 1, 1996
28.583
-0.726
-2.48%
jan 1, 1997
26.971
-1.613
-5.64%
jan 1, 1998
28.86
+1.89
7.01%
jan 1, 1999
29.043
+0.183
0.63%
jan 1, 2000
30.558
+1.515
5.22%
jan 1, 2001
20.959
-9.598
-31.41%
jan 1, 2002
19.554
-1.405
-6.7%
jan 1, 2003
19.551
-0.003
-0.01%
jan 1, 2004
19.826
+0.274
1.4%
jan 1, 2005
21.443
+1.617
8.16%
jan 1, 2006
25.237
+3.795
17.7%
jan 1, 2007
26.327
+1.089
4.32%
jan 1, 2008
24.945
-1.382
-5.25%
jan 1, 2009
22.25
-2.695
-10.8%
jan 1, 2010
19.369
-2.881
-12.95%
jan 1, 2011
18.527
-0.843
-4.35%
jan 1, 2012
19.879
+1.352
7.3%
jan 1, 2013
17.331
-2.547
-12.81%
jan 1, 2014
13.798
-3.534
-20.39%
jan 1, 2015
15.881
+2.083
15.1%
jan 1, 2016
20.844
+4.964
31.26%
Ranking of countries by current statistics by years


Comments: