29
/
en
AIzaSyAYiBZKx7MnpbEhh9jyipgxe19OcubqV5w
April 1, 2024
48175
Middle East & North Africa
MEA
false
2
1
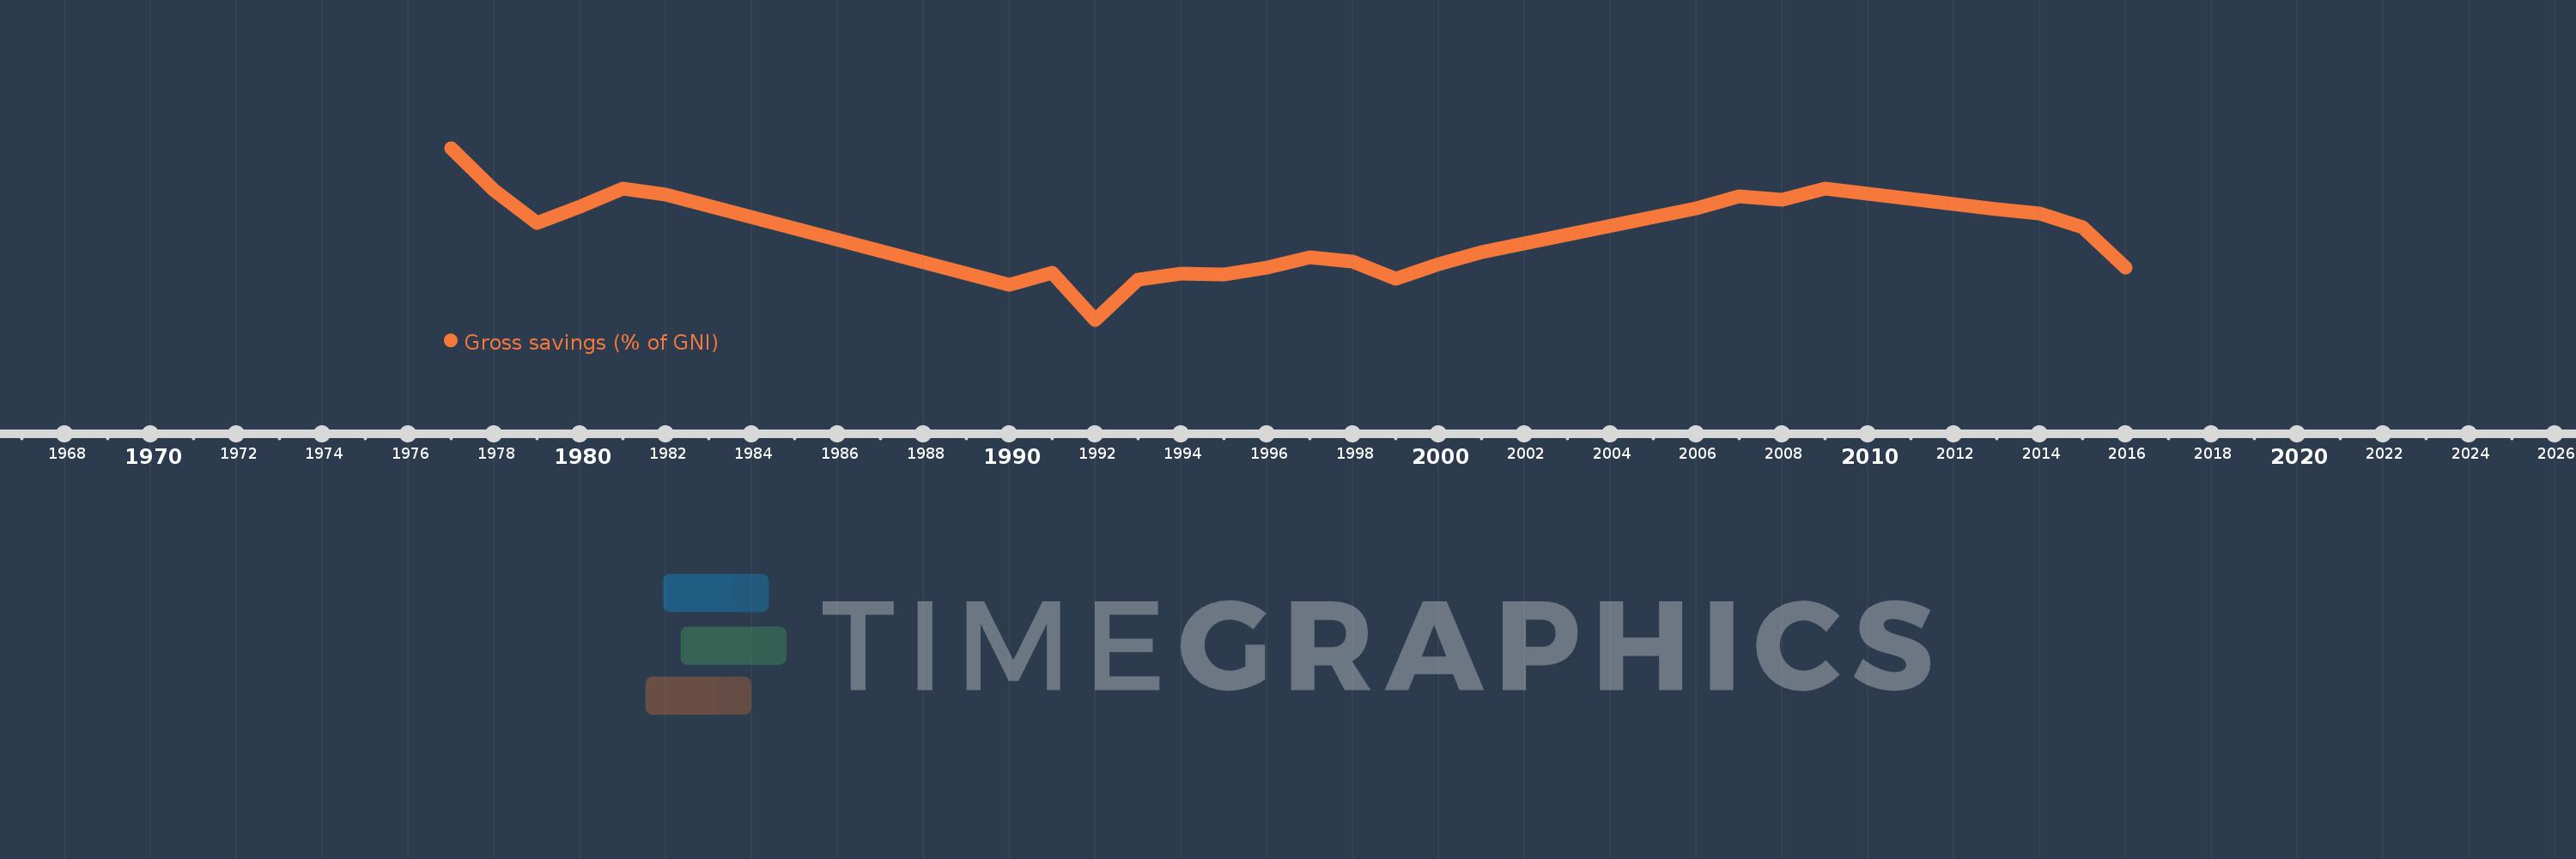
Gross savings (% of GNI)
2016,2015,2014,2013,2012,2009,2008,2007,2006,2001,2000,1999,1998,1997,1996,1995,1994,1993,1992,1991,1990,1982,1981,1980,1979,1978,1977
This statistics in other country:
AfghanistanAlbaniaAlgeriaAngolaAntigua and BarbudaArab WorldArgentinaArmeniaAustraliaAustriaAzerbaijanBahamas, TheBahrainBangladeshBarbadosBelarusBelgiumBelizeBeninBermudaBhutanBoliviaBosnia and HerzegovinaBotswanaBrazilBrunei DarussalamBulgariaBurkina FasoBurundiCabo VerdeCambodiaCameroonCanadaCaribbean small statesCentral African RepublicCentral Europe and the BalticsChadChileChinaColombiaComorosCongo, Dem. Rep.Congo, Rep.Costa RicaCote d'IvoireCroatiaCyprusCzech RepublicDenmarkDjiboutiDominicaDominican RepublicEarly-demographic dividendEast Asia & PacificEast Asia & Pacific (excluding high income)East Asia & Pacific (IDA & IBRD countries)EcuadorEgypt, Arab Rep.El SalvadorEquatorial GuineaEritreaEstoniaEthiopiaEuro areaEurope & Central AsiaEurope & Central Asia (excluding high income)Europe & Central Asia (IDA & IBRD countries)European UnionFaroe IslandsFijiFinlandFragile and conflict affected situationsFranceGabonGambia, TheGeorgiaGermanyGhanaGreeceGrenadaGuatemalaGuineaGuinea-BissauGuyanaHaitiHeavily indebted poor countries (HIPC)High incomeHondurasHong Kong SAR, ChinaHungaryIBRD onlyIcelandIDA & IBRD totalIDA blendIDA onlyIDA totalIndiaIndonesiaIran, Islamic Rep.IraqIrelandIsraelItalyJamaicaJapanJordanKazakhstanKenyaKiribatiKorea, Rep.KosovoKuwaitKyrgyz RepublicLao PDRLate-demographic dividendLatin America & Caribbean Latin America & Caribbean (excluding high income)Latin America & the Caribbean (IDA & IBRD countries)LatviaLeast developed countries: UN classificationLebanonLesothoLiberiaLibyaLithuaniaLow & middle incomeLow incomeLower middle incomeLuxembourgMacao SAR, ChinaMacedonia, FYRMadagascarMalawiMalaysiaMaldivesMaliMaltaMauritaniaMauritiusMexicoMiddle East & North AfricaMiddle East & North Africa (excluding high income)Middle East & North Africa (IDA & IBRD countries)Middle incomeMoldovaMongoliaMontenegroMoroccoMozambiqueNamibiaNepalNetherlandsNew ZealandNicaraguaNigerNigeriaNorth AmericaNorwayOECD membersOmanOther small statesPacific island small statesPakistanPanamaPapua New GuineaParaguayPeruPhilippinesPolandPortugalPost-demographic dividendPre-demographic dividendQatarRomaniaRussian FederationRwandaSaudi ArabiaSenegalSerbiaSeychellesSierra LeoneSingaporeSlovak RepublicSloveniaSmall statesSolomon IslandsSouth AfricaSouth AsiaSouth Asia (IDA & IBRD)South SudanSpainSri LankaSt. Kitts and NevisSt. LuciaSt. Vincent and the GrenadinesSub-Saharan Africa Sub-Saharan Africa (excluding high income)Sub-Saharan Africa (IDA & IBRD countries)SudanSurinameSwazilandSwedenSwitzerlandSyrian Arab RepublicTajikistanTanzaniaThailandTimor-LesteTogoTongaTrinidad and TobagoTunisiaTurkeyUgandaUkraineUnited KingdomUnited StatesUpper middle incomeUruguayVanuatuVenezuela, RBVietnamWest Bank and GazaWorldYemen, Rep.ZambiaZimbabwe Timeline:
This timeline shows a graph from 1977 to 2016 of Middle East & North Africa. No data until 1976. Number of actual observations by date: 27.
Source name:
World Development Indicators
Source organization:
World Bank national accounts data, and OECD National Accounts data files.
Categories, topics:
Economy & Growth
Last updated:
apr 23, 2017
Indicators value changes by year
Minimum:
11.352
jan 1, 1992
Maximum:
51.849
jan 1, 1977
At the date of observation
Value
Absolute change
Change from previous value
jan 1, 1977
51.849
+51.849
0.0%
jan 1, 1978
41.882
-9.967
-19.22%
jan 1, 1979
34.194
-7.688
-18.36%
jan 1, 1980
37.985
+3.79
11.08%
jan 1, 1981
42.23
+4.246
11.18%
jan 1, 1982
40.753
-1.477
-3.5%
jan 1, 1990
19.642
-21.111
-51.8%
jan 1, 1991
22.471
+2.829
14.4%
jan 1, 1992
11.352
-11.119
-49.48%
jan 1, 1993
20.901
+9.549
84.12%
jan 1, 1994
22.236
+1.335
6.39%
jan 1, 1995
22.089
-0.147
-0.66%
jan 1, 1996
23.616
+1.527
6.91%
jan 1, 1997
26.026
+2.41
10.21%
jan 1, 1998
24.997
-1.028
-3.95%
jan 1, 1999
21.086
-3.912
-15.65%
jan 1, 2000
24.443
+3.358
15.93%
jan 1, 2001
27.383
+2.94
12.03%
jan 1, 2006
37.578
+10.194
37.23%
jan 1, 2007
40.399
+2.822
7.51%
jan 1, 2008
39.717
-0.682
-1.69%
jan 1, 2009
42.262
+2.545
6.41%
jan 1, 2012
38.59
-3.672
-8.69%
jan 1, 2013
37.453
-1.137
-2.95%
jan 1, 2014
36.403
-1.05
-2.8%
jan 1, 2015
33.174
-3.228
-8.87%
jan 1, 2016
23.638
-9.537
-28.75%
Ranking of countries by current statistics by years


Comments: