29
/
en
AIzaSyAYiBZKx7MnpbEhh9jyipgxe19OcubqV5w
April 1, 2024
107324
Colombia
COL
true
2
1
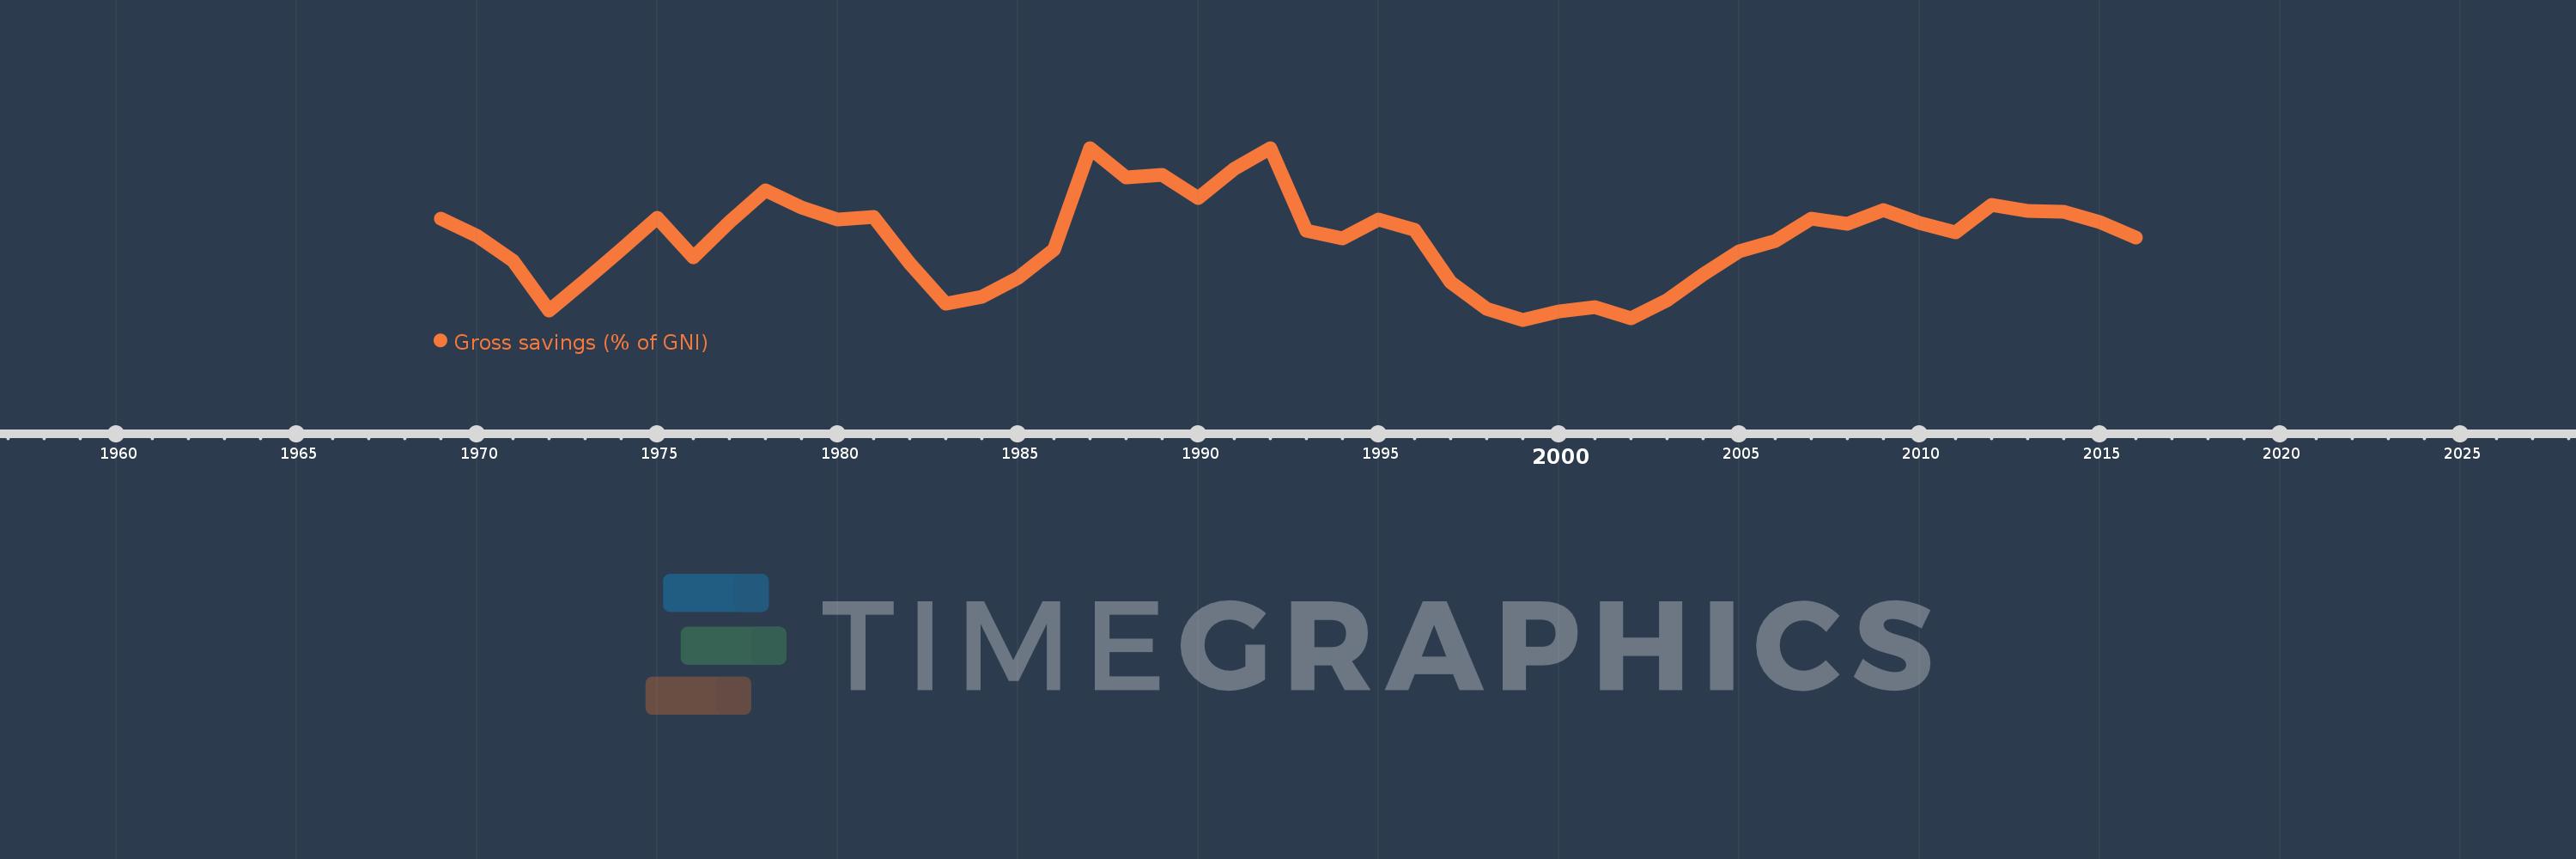
Gross savings (% of GNI)
2016,2015,2014,2013,2012,2011,2010,2009,2008,2007,2006,2005,2004,2003,2002,2001,2000,1999,1998,1997,1996,1995,1994,1993,1992,1991,1990,1989,1988,1987,1986,1985,1984,1983,1982,1981,1980,1979,1978,1977,1976,1975,1974,1973,1972,1971,1970,1969
This statistics in other country:
AfghanistanAlbaniaAlgeriaAngolaAntigua and BarbudaArab WorldArgentinaArmeniaAustraliaAustriaAzerbaijanBahamas, TheBahrainBangladeshBarbadosBelarusBelgiumBelizeBeninBermudaBhutanBoliviaBosnia and HerzegovinaBotswanaBrazilBrunei DarussalamBulgariaBurkina FasoBurundiCabo VerdeCambodiaCameroonCanadaCaribbean small statesCentral African RepublicCentral Europe and the BalticsChadChileChinaColombiaComorosCongo, Dem. Rep.Congo, Rep.Costa RicaCote d'IvoireCroatiaCyprusCzech RepublicDenmarkDjiboutiDominicaDominican RepublicEarly-demographic dividendEast Asia & PacificEast Asia & Pacific (excluding high income)East Asia & Pacific (IDA & IBRD countries)EcuadorEgypt, Arab Rep.El SalvadorEquatorial GuineaEritreaEstoniaEthiopiaEuro areaEurope & Central AsiaEurope & Central Asia (excluding high income)Europe & Central Asia (IDA & IBRD countries)European UnionFaroe IslandsFijiFinlandFragile and conflict affected situationsFranceGabonGambia, TheGeorgiaGermanyGhanaGreeceGrenadaGuatemalaGuineaGuinea-BissauGuyanaHaitiHeavily indebted poor countries (HIPC)High incomeHondurasHong Kong SAR, ChinaHungaryIBRD onlyIcelandIDA & IBRD totalIDA blendIDA onlyIDA totalIndiaIndonesiaIran, Islamic Rep.IraqIrelandIsraelItalyJamaicaJapanJordanKazakhstanKenyaKiribatiKorea, Rep.KosovoKuwaitKyrgyz RepublicLao PDRLate-demographic dividendLatin America & Caribbean Latin America & Caribbean (excluding high income)Latin America & the Caribbean (IDA & IBRD countries)LatviaLeast developed countries: UN classificationLebanonLesothoLiberiaLibyaLithuaniaLow & middle incomeLow incomeLower middle incomeLuxembourgMacao SAR, ChinaMacedonia, FYRMadagascarMalawiMalaysiaMaldivesMaliMaltaMauritaniaMauritiusMexicoMiddle East & North AfricaMiddle East & North Africa (excluding high income)Middle East & North Africa (IDA & IBRD countries)Middle incomeMoldovaMongoliaMontenegroMoroccoMozambiqueNamibiaNepalNetherlandsNew ZealandNicaraguaNigerNigeriaNorth AmericaNorwayOECD membersOmanOther small statesPacific island small statesPakistanPanamaPapua New GuineaParaguayPeruPhilippinesPolandPortugalPost-demographic dividendPre-demographic dividendQatarRomaniaRussian FederationRwandaSaudi ArabiaSenegalSerbiaSeychellesSierra LeoneSingaporeSlovak RepublicSloveniaSmall statesSolomon IslandsSouth AfricaSouth AsiaSouth Asia (IDA & IBRD)South SudanSpainSri LankaSt. Kitts and NevisSt. LuciaSt. Vincent and the GrenadinesSub-Saharan Africa Sub-Saharan Africa (excluding high income)Sub-Saharan Africa (IDA & IBRD countries)SudanSurinameSwazilandSwedenSwitzerlandSyrian Arab RepublicTajikistanTanzaniaThailandTimor-LesteTogoTongaTrinidad and TobagoTunisiaTurkeyUgandaUkraineUnited KingdomUnited StatesUpper middle incomeUruguayVanuatuVenezuela, RBVietnamWest Bank and GazaWorldYemen, Rep.ZambiaZimbabwe Timeline:
This timeline shows a graph from 1969 to 2016 of Colombia. No data until 1968. Number of actual observations by date: 48.
Source name:
World Development Indicators
Source organization:
World Bank national accounts data, and OECD National Accounts data files.
Categories, topics:
Economy & Growth
Last updated:
apr 23, 2017
Indicators value changes by year
Minimum:
13.042
jan 1, 1999
Maximum:
24.131
jan 1, 1992
At the date of observation
Value
Absolute change
Change from previous value
jan 1, 1969
19.546
+19.546
0.0%
jan 1, 1970
18.45
-1.097
-5.61%
jan 1, 1971
16.824
-1.626
-8.81%
jan 1, 1972
13.615
-3.209
-19.07%
jan 1, 1973
15.578
+1.963
14.42%
jan 1, 1974
17.557
+1.979
12.7%
jan 1, 1975
19.638
+2.08
11.85%
jan 1, 1976
17.082
-2.556
-13.02%
jan 1, 1977
19.369
+2.287
13.39%
jan 1, 1978
21.374
+2.005
10.35%
jan 1, 1979
20.284
-1.09
-5.1%
jan 1, 1980
19.488
-0.796
-3.93%
jan 1, 1981
19.68
+0.192
0.98%
jan 1, 1982
16.704
-2.976
-15.12%
jan 1, 1983
14.077
-2.626
-15.72%
jan 1, 1984
14.496
+0.419
2.98%
jan 1, 1985
15.754
+1.258
8.68%
jan 1, 1986
17.591
+1.837
11.66%
jan 1, 1987
24.118
+6.527
37.11%
jan 1, 1988
22.234
-1.884
-7.81%
jan 1, 1989
22.419
+0.185
0.83%
jan 1, 1990
20.91
-1.509
-6.73%
jan 1, 1991
22.808
+1.898
9.08%
jan 1, 1992
24.131
+1.323
5.8%
jan 1, 1993
18.777
-5.354
-22.19%
jan 1, 1994
18.268
-0.509
-2.71%
jan 1, 1995
19.495
+1.227
6.72%
jan 1, 1996
18.847
-0.648
-3.32%
jan 1, 1997
15.445
-3.402
-18.05%
jan 1, 1998
13.761
-1.684
-10.9%
jan 1, 1999
13.042
-0.719
-5.23%
jan 1, 2000
13.594
+0.551
4.23%
jan 1, 2001
13.874
+0.28
2.06%
jan 1, 2002
13.159
-0.715
-5.16%
jan 1, 2003
14.308
+1.149
8.73%
jan 1, 2004
15.941
+1.633
11.41%
jan 1, 2005
17.434
+1.493
9.37%
jan 1, 2006
18.13
+0.696
3.99%
jan 1, 2007
19.589
+1.459
8.05%
jan 1, 2008
19.241
-0.348
-1.77%
jan 1, 2009
20.122
+0.88
4.58%
jan 1, 2010
19.286
-0.836
-4.15%
jan 1, 2011
18.668
-0.618
-3.21%
jan 1, 2012
20.449
+1.781
9.54%
jan 1, 2013
20.082
-0.367
-1.79%
jan 1, 2014
20.013
-0.069
-0.34%
jan 1, 2015
19.358
-0.656
-3.28%
jan 1, 2016
18.338
-1.02
-5.27%
Ranking of countries by current statistics by years


Comments: