29
/
en
AIzaSyAYiBZKx7MnpbEhh9jyipgxe19OcubqV5w
April 1, 2024
170023
Korea, Rep.
KOR
true
2
1
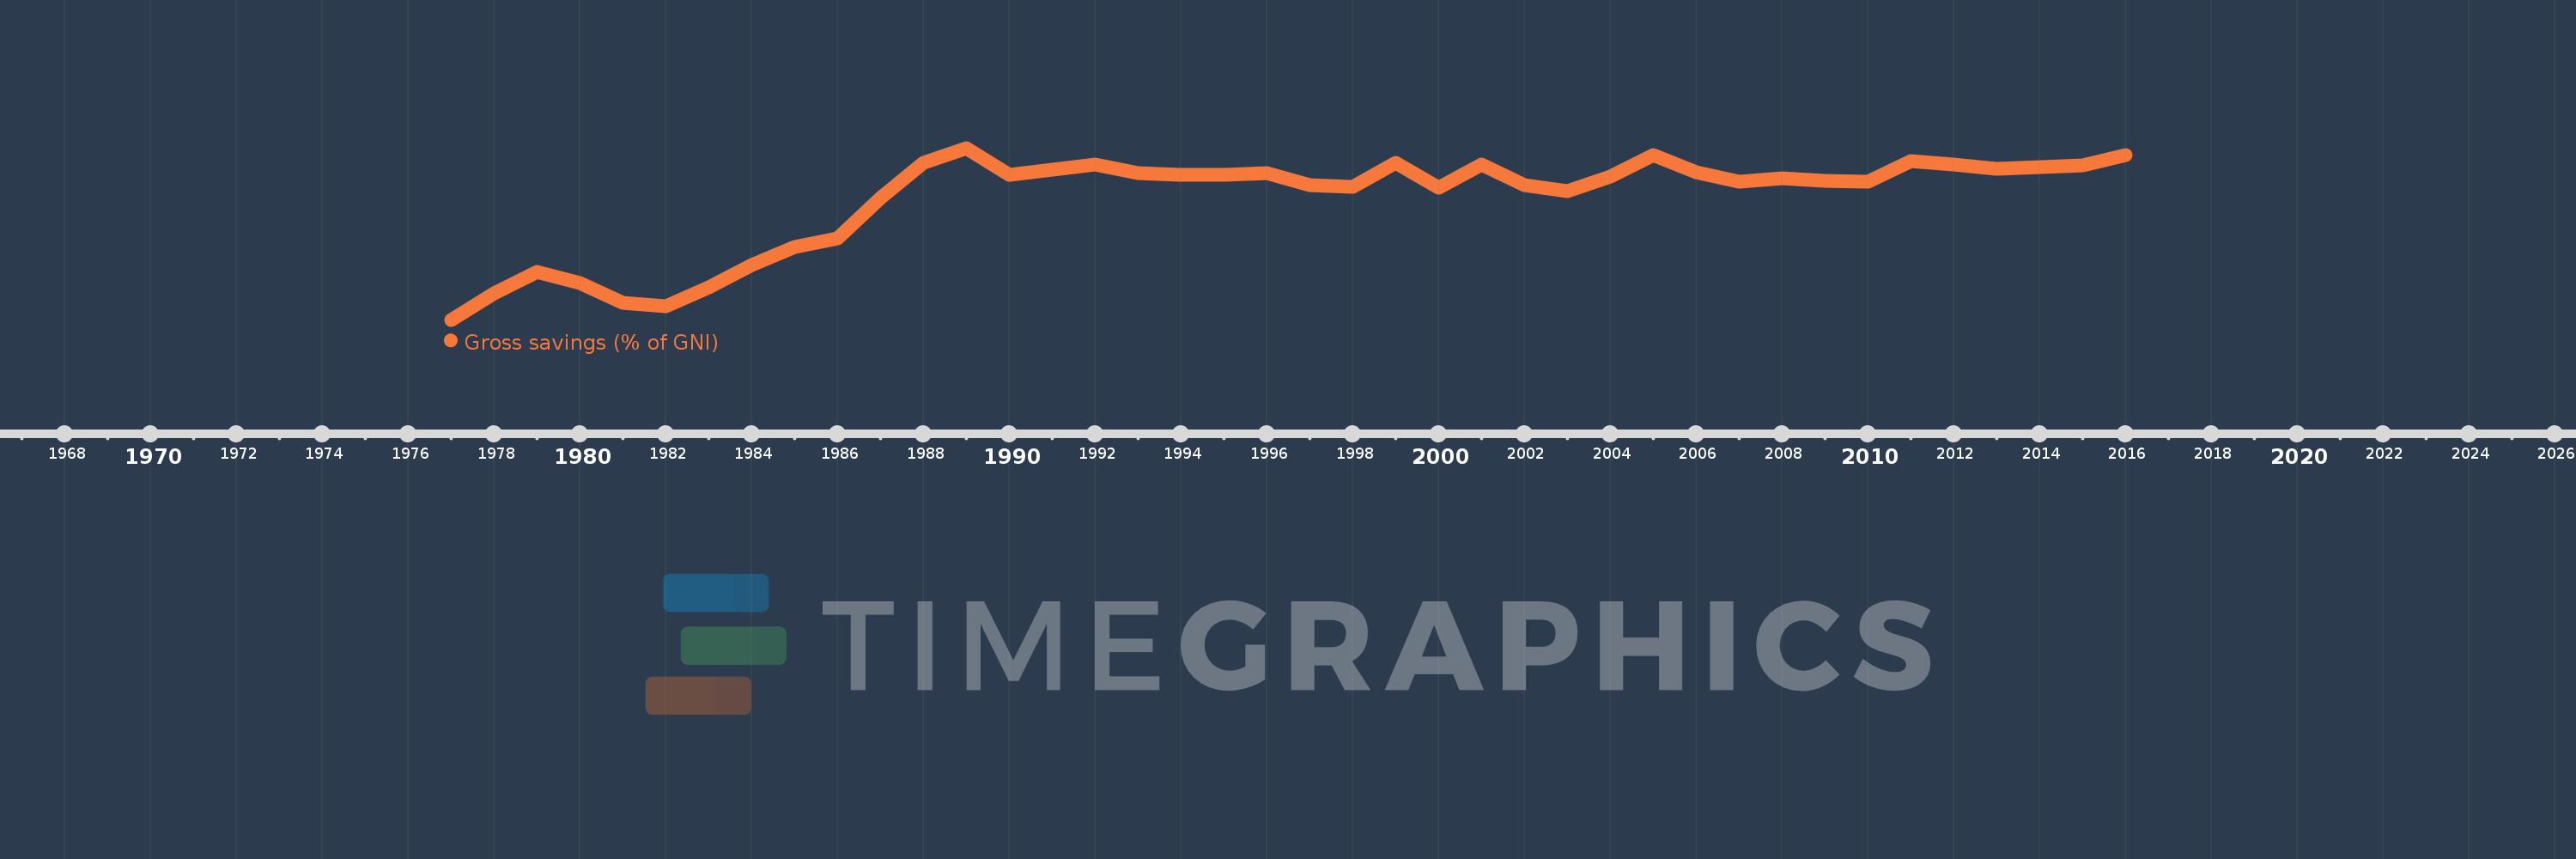
Gross savings (% of GNI)
2016,2015,2014,2013,2012,2011,2010,2009,2008,2007,2006,2005,2004,2003,2002,2001,2000,1999,1998,1997,1996,1995,1994,1993,1992,1991,1990,1989,1988,1987,1986,1985,1984,1983,1982,1981,1980,1979,1978,1977
This statistics in other country:
AfghanistanAlbaniaAlgeriaAngolaAntigua and BarbudaArab WorldArgentinaArmeniaAustraliaAustriaAzerbaijanBahamas, TheBahrainBangladeshBarbadosBelarusBelgiumBelizeBeninBermudaBhutanBoliviaBosnia and HerzegovinaBotswanaBrazilBrunei DarussalamBulgariaBurkina FasoBurundiCabo VerdeCambodiaCameroonCanadaCaribbean small statesCentral African RepublicCentral Europe and the BalticsChadChileChinaColombiaComorosCongo, Dem. Rep.Congo, Rep.Costa RicaCote d'IvoireCroatiaCyprusCzech RepublicDenmarkDjiboutiDominicaDominican RepublicEarly-demographic dividendEast Asia & PacificEast Asia & Pacific (excluding high income)East Asia & Pacific (IDA & IBRD countries)EcuadorEgypt, Arab Rep.El SalvadorEquatorial GuineaEritreaEstoniaEthiopiaEuro areaEurope & Central AsiaEurope & Central Asia (excluding high income)Europe & Central Asia (IDA & IBRD countries)European UnionFaroe IslandsFijiFinlandFragile and conflict affected situationsFranceGabonGambia, TheGeorgiaGermanyGhanaGreeceGrenadaGuatemalaGuineaGuinea-BissauGuyanaHaitiHeavily indebted poor countries (HIPC)High incomeHondurasHong Kong SAR, ChinaHungaryIBRD onlyIcelandIDA & IBRD totalIDA blendIDA onlyIDA totalIndiaIndonesiaIran, Islamic Rep.IraqIrelandIsraelItalyJamaicaJapanJordanKazakhstanKenyaKiribatiKorea, Rep.KosovoKuwaitKyrgyz RepublicLao PDRLate-demographic dividendLatin America & Caribbean Latin America & Caribbean (excluding high income)Latin America & the Caribbean (IDA & IBRD countries)LatviaLeast developed countries: UN classificationLebanonLesothoLiberiaLibyaLithuaniaLow & middle incomeLow incomeLower middle incomeLuxembourgMacao SAR, ChinaMacedonia, FYRMadagascarMalawiMalaysiaMaldivesMaliMaltaMauritaniaMauritiusMexicoMiddle East & North AfricaMiddle East & North Africa (excluding high income)Middle East & North Africa (IDA & IBRD countries)Middle incomeMoldovaMongoliaMontenegroMoroccoMozambiqueNamibiaNepalNetherlandsNew ZealandNicaraguaNigerNigeriaNorth AmericaNorwayOECD membersOmanOther small statesPacific island small statesPakistanPanamaPapua New GuineaParaguayPeruPhilippinesPolandPortugalPost-demographic dividendPre-demographic dividendQatarRomaniaRussian FederationRwandaSaudi ArabiaSenegalSerbiaSeychellesSierra LeoneSingaporeSlovak RepublicSloveniaSmall statesSolomon IslandsSouth AfricaSouth AsiaSouth Asia (IDA & IBRD)South SudanSpainSri LankaSt. Kitts and NevisSt. LuciaSt. Vincent and the GrenadinesSub-Saharan Africa Sub-Saharan Africa (excluding high income)Sub-Saharan Africa (IDA & IBRD countries)SudanSurinameSwazilandSwedenSwitzerlandSyrian Arab RepublicTajikistanTanzaniaThailandTimor-LesteTogoTongaTrinidad and TobagoTunisiaTurkeyUgandaUkraineUnited KingdomUnited StatesUpper middle incomeUruguayVanuatuVenezuela, RBVietnamWest Bank and GazaWorldYemen, Rep.ZambiaZimbabwe Timeline:
This timeline shows a graph from 1977 to 2016 of Korea, Rep.. No data until 1976. Number of actual observations by date: 40.
Source name:
World Development Indicators
Source organization:
World Bank national accounts data, and OECD National Accounts data files.
Categories, topics:
Economy & Growth
Last updated:
apr 23, 2017
Indicators value changes by year
Minimum:
19.155
jan 1, 1977
Maximum:
36.103
jan 1, 1989
At the date of observation
Value
Absolute change
Change from previous value
jan 1, 1977
19.155
+19.155
0.0%
jan 1, 1978
21.755
+2.6
13.57%
jan 1, 1979
23.865
+2.111
9.7%
jan 1, 1980
22.799
-1.066
-4.47%
jan 1, 1981
20.808
-1.992
-8.74%
jan 1, 1982
20.448
-0.359
-1.73%
jan 1, 1983
22.318
+1.869
9.14%
jan 1, 1984
24.544
+2.226
9.98%
jan 1, 1985
26.37
+1.826
7.44%
jan 1, 1986
27.16
+0.789
2.99%
jan 1, 1987
31.13
+3.97
14.62%
jan 1, 1988
34.639
+3.509
11.27%
jan 1, 1989
36.103
+1.464
4.23%
jan 1, 1990
33.482
-2.621
-7.26%
jan 1, 1991
33.959
+0.477
1.42%
jan 1, 1992
34.491
+0.532
1.57%
jan 1, 1993
33.632
-0.858
-2.49%
jan 1, 1994
33.45
-0.182
-0.54%
jan 1, 1995
33.444
-0.007
-0.02%
jan 1, 1996
33.624
+0.18
0.54%
jan 1, 1997
32.434
-1.19
-3.54%
jan 1, 1998
32.271
-0.163
-0.5%
jan 1, 1999
34.609
+2.338
7.24%
jan 1, 2000
32.213
-2.395
-6.92%
jan 1, 2001
34.503
+2.289
7.11%
jan 1, 2002
32.413
-2.089
-6.06%
jan 1, 2003
31.817
-0.596
-1.84%
jan 1, 2004
33.303
+1.486
4.67%
jan 1, 2005
35.416
+2.113
6.35%
jan 1, 2006
33.717
-1.699
-4.8%
jan 1, 2007
32.798
-0.919
-2.73%
jan 1, 2008
33.112
+0.314
0.96%
jan 1, 2009
32.877
-0.235
-0.71%
jan 1, 2010
32.75
-0.127
-0.39%
jan 1, 2011
34.788
+2.038
6.22%
jan 1, 2012
34.448
-0.34
-0.98%
jan 1, 2013
34.025
-0.423
-1.23%
jan 1, 2014
34.23
+0.205
0.6%
jan 1, 2015
34.384
+0.154
0.45%
jan 1, 2016
35.412
+1.028
2.99%
Ranking of countries by current statistics by years


Comments: