29
/
en
AIzaSyAYiBZKx7MnpbEhh9jyipgxe19OcubqV5w
April 1, 2024
248790
Sri Lanka
LKA
true
2
1
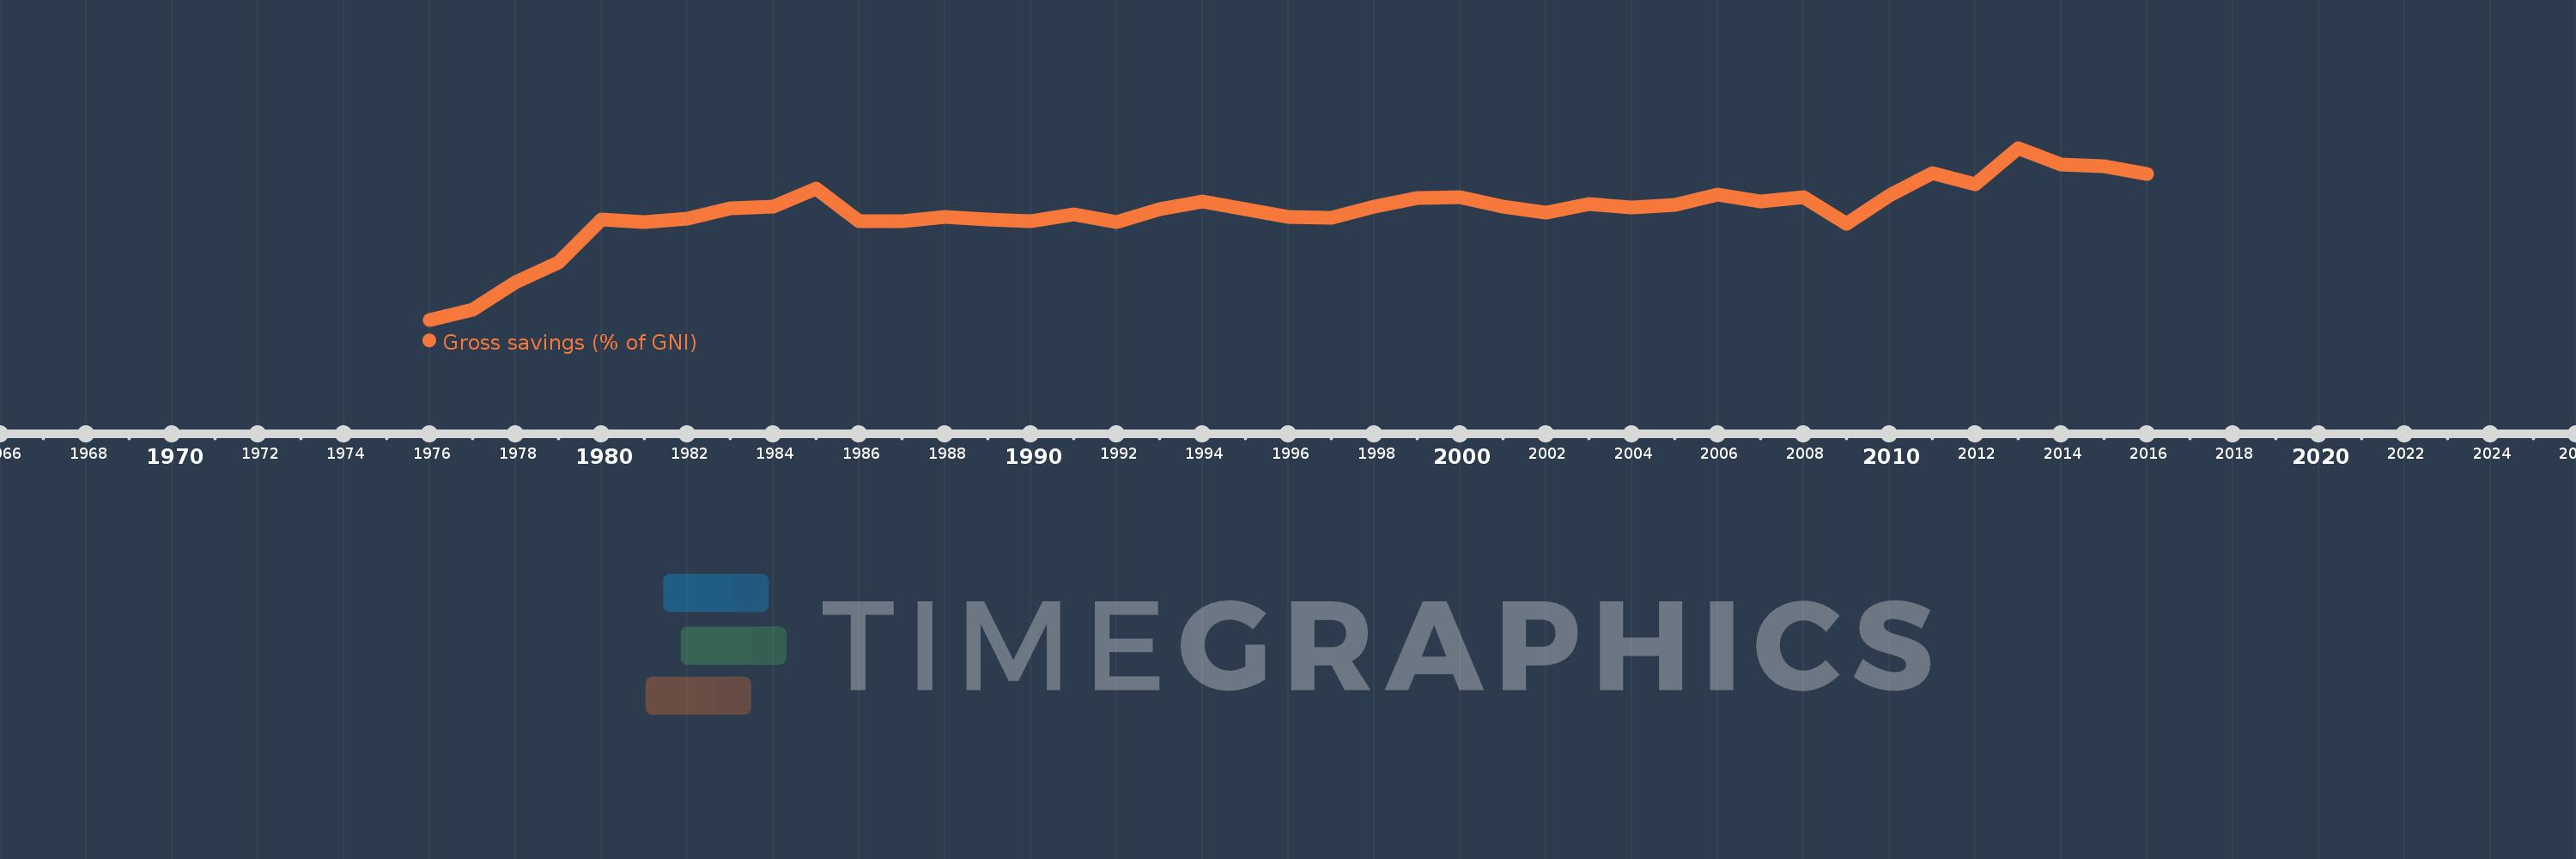
Gross savings (% of GNI)
2016,2015,2014,2013,2012,2011,2010,2009,2008,2007,2006,2005,2004,2003,2002,2001,2000,1999,1998,1997,1996,1995,1994,1993,1992,1991,1990,1989,1988,1987,1986,1985,1984,1983,1982,1981,1980,1979,1978,1977,1976
This statistics in other country:
AfghanistanAlbaniaAlgeriaAngolaAntigua and BarbudaArab WorldArgentinaArmeniaAustraliaAustriaAzerbaijanBahamas, TheBahrainBangladeshBarbadosBelarusBelgiumBelizeBeninBermudaBhutanBoliviaBosnia and HerzegovinaBotswanaBrazilBrunei DarussalamBulgariaBurkina FasoBurundiCabo VerdeCambodiaCameroonCanadaCaribbean small statesCentral African RepublicCentral Europe and the BalticsChadChileChinaColombiaComorosCongo, Dem. Rep.Congo, Rep.Costa RicaCote d'IvoireCroatiaCyprusCzech RepublicDenmarkDjiboutiDominicaDominican RepublicEarly-demographic dividendEast Asia & PacificEast Asia & Pacific (excluding high income)East Asia & Pacific (IDA & IBRD countries)EcuadorEgypt, Arab Rep.El SalvadorEquatorial GuineaEritreaEstoniaEthiopiaEuro areaEurope & Central AsiaEurope & Central Asia (excluding high income)Europe & Central Asia (IDA & IBRD countries)European UnionFaroe IslandsFijiFinlandFragile and conflict affected situationsFranceGabonGambia, TheGeorgiaGermanyGhanaGreeceGrenadaGuatemalaGuineaGuinea-BissauGuyanaHaitiHeavily indebted poor countries (HIPC)High incomeHondurasHong Kong SAR, ChinaHungaryIBRD onlyIcelandIDA & IBRD totalIDA blendIDA onlyIDA totalIndiaIndonesiaIran, Islamic Rep.IraqIrelandIsraelItalyJamaicaJapanJordanKazakhstanKenyaKiribatiKorea, Rep.KosovoKuwaitKyrgyz RepublicLao PDRLate-demographic dividendLatin America & Caribbean Latin America & Caribbean (excluding high income)Latin America & the Caribbean (IDA & IBRD countries)LatviaLeast developed countries: UN classificationLebanonLesothoLiberiaLibyaLithuaniaLow & middle incomeLow incomeLower middle incomeLuxembourgMacao SAR, ChinaMacedonia, FYRMadagascarMalawiMalaysiaMaldivesMaliMaltaMauritaniaMauritiusMexicoMiddle East & North AfricaMiddle East & North Africa (excluding high income)Middle East & North Africa (IDA & IBRD countries)Middle incomeMoldovaMongoliaMontenegroMoroccoMozambiqueNamibiaNepalNetherlandsNew ZealandNicaraguaNigerNigeriaNorth AmericaNorwayOECD membersOmanOther small statesPacific island small statesPakistanPanamaPapua New GuineaParaguayPeruPhilippinesPolandPortugalPost-demographic dividendPre-demographic dividendQatarRomaniaRussian FederationRwandaSaudi ArabiaSenegalSerbiaSeychellesSierra LeoneSingaporeSlovak RepublicSloveniaSmall statesSolomon IslandsSouth AfricaSouth AsiaSouth Asia (IDA & IBRD)South SudanSpainSri LankaSt. Kitts and NevisSt. LuciaSt. Vincent and the GrenadinesSub-Saharan Africa Sub-Saharan Africa (excluding high income)Sub-Saharan Africa (IDA & IBRD countries)SudanSurinameSwazilandSwedenSwitzerlandSyrian Arab RepublicTajikistanTanzaniaThailandTimor-LesteTogoTongaTrinidad and TobagoTunisiaTurkeyUgandaUkraineUnited KingdomUnited StatesUpper middle incomeUruguayVanuatuVenezuela, RBVietnamWest Bank and GazaWorldYemen, Rep.ZambiaZimbabwe Timeline:
This timeline shows a graph from 1976 to 2016 of Sri Lanka. No data until 1975. Number of actual observations by date: 41.
Source name:
World Development Indicators
Source organization:
World Bank national accounts data, and OECD National Accounts data files.
Categories, topics:
Economy & Growth
Last updated:
apr 23, 2017
Indicators value changes by year
Minimum:
-1.024
jan 1, 1976
Maximum:
33.903
jan 1, 2013
At the date of observation
Value
Absolute change
Change from previous value
jan 1, 1976
-1.024
-1.024
0.0%
jan 1, 1977
0.933
+1.957
-191.16%
jan 1, 1978
6.641
+5.708
611.65%
jan 1, 1979
10.599
+3.958
59.6%
jan 1, 1980
19.34
+8.741
82.46%
jan 1, 1981
18.857
-0.483
-2.5%
jan 1, 1982
19.483
+0.626
3.32%
jan 1, 1983
21.602
+2.119
10.88%
jan 1, 1984
21.996
+0.394
1.83%
jan 1, 1985
25.694
+3.698
16.81%
jan 1, 1986
18.935
-6.759
-26.31%
jan 1, 1987
19.064
+0.129
0.68%
jan 1, 1988
19.859
+0.794
4.17%
jan 1, 1989
19.356
-0.502
-2.53%
jan 1, 1990
19.071
-0.285
-1.47%
jan 1, 1991
20.468
+1.397
7.33%
jan 1, 1992
18.792
-1.676
-8.19%
jan 1, 1993
21.473
+2.681
14.26%
jan 1, 1994
23.012
+1.539
7.17%
jan 1, 1995
21.518
-1.494
-6.49%
jan 1, 1996
19.862
-1.656
-7.69%
jan 1, 1997
19.65
-0.212
-1.07%
jan 1, 1998
21.934
+2.284
11.63%
jan 1, 1999
23.641
+1.706
7.78%
jan 1, 2000
23.942
+0.301
1.27%
jan 1, 2001
21.95
-1.992
-8.32%
jan 1, 2002
20.734
-1.216
-5.54%
jan 1, 2003
22.423
+1.689
8.15%
jan 1, 2004
21.854
-0.568
-2.54%
jan 1, 2005
22.34
+0.486
2.22%
jan 1, 2006
24.462
+2.122
9.5%
jan 1, 2007
23.003
-1.459
-5.96%
jan 1, 2008
23.887
+0.884
3.84%
jan 1, 2009
18.473
-5.414
-22.67%
jan 1, 2010
24.209
+5.736
31.05%
jan 1, 2011
28.771
+4.562
18.84%
jan 1, 2012
26.551
-2.22
-7.72%
jan 1, 2013
33.903
+7.352
27.69%
jan 1, 2014
30.585
-3.318
-9.79%
jan 1, 2015
30.171
-0.413
-1.35%
jan 1, 2016
28.551
-1.621
-5.37%
Ranking of countries by current statistics by years


Comments: