29
/
en
AIzaSyAYiBZKx7MnpbEhh9jyipgxe19OcubqV5w
April 1, 2024
249937
St. Kitts and Nevis
KNA
true
2
1
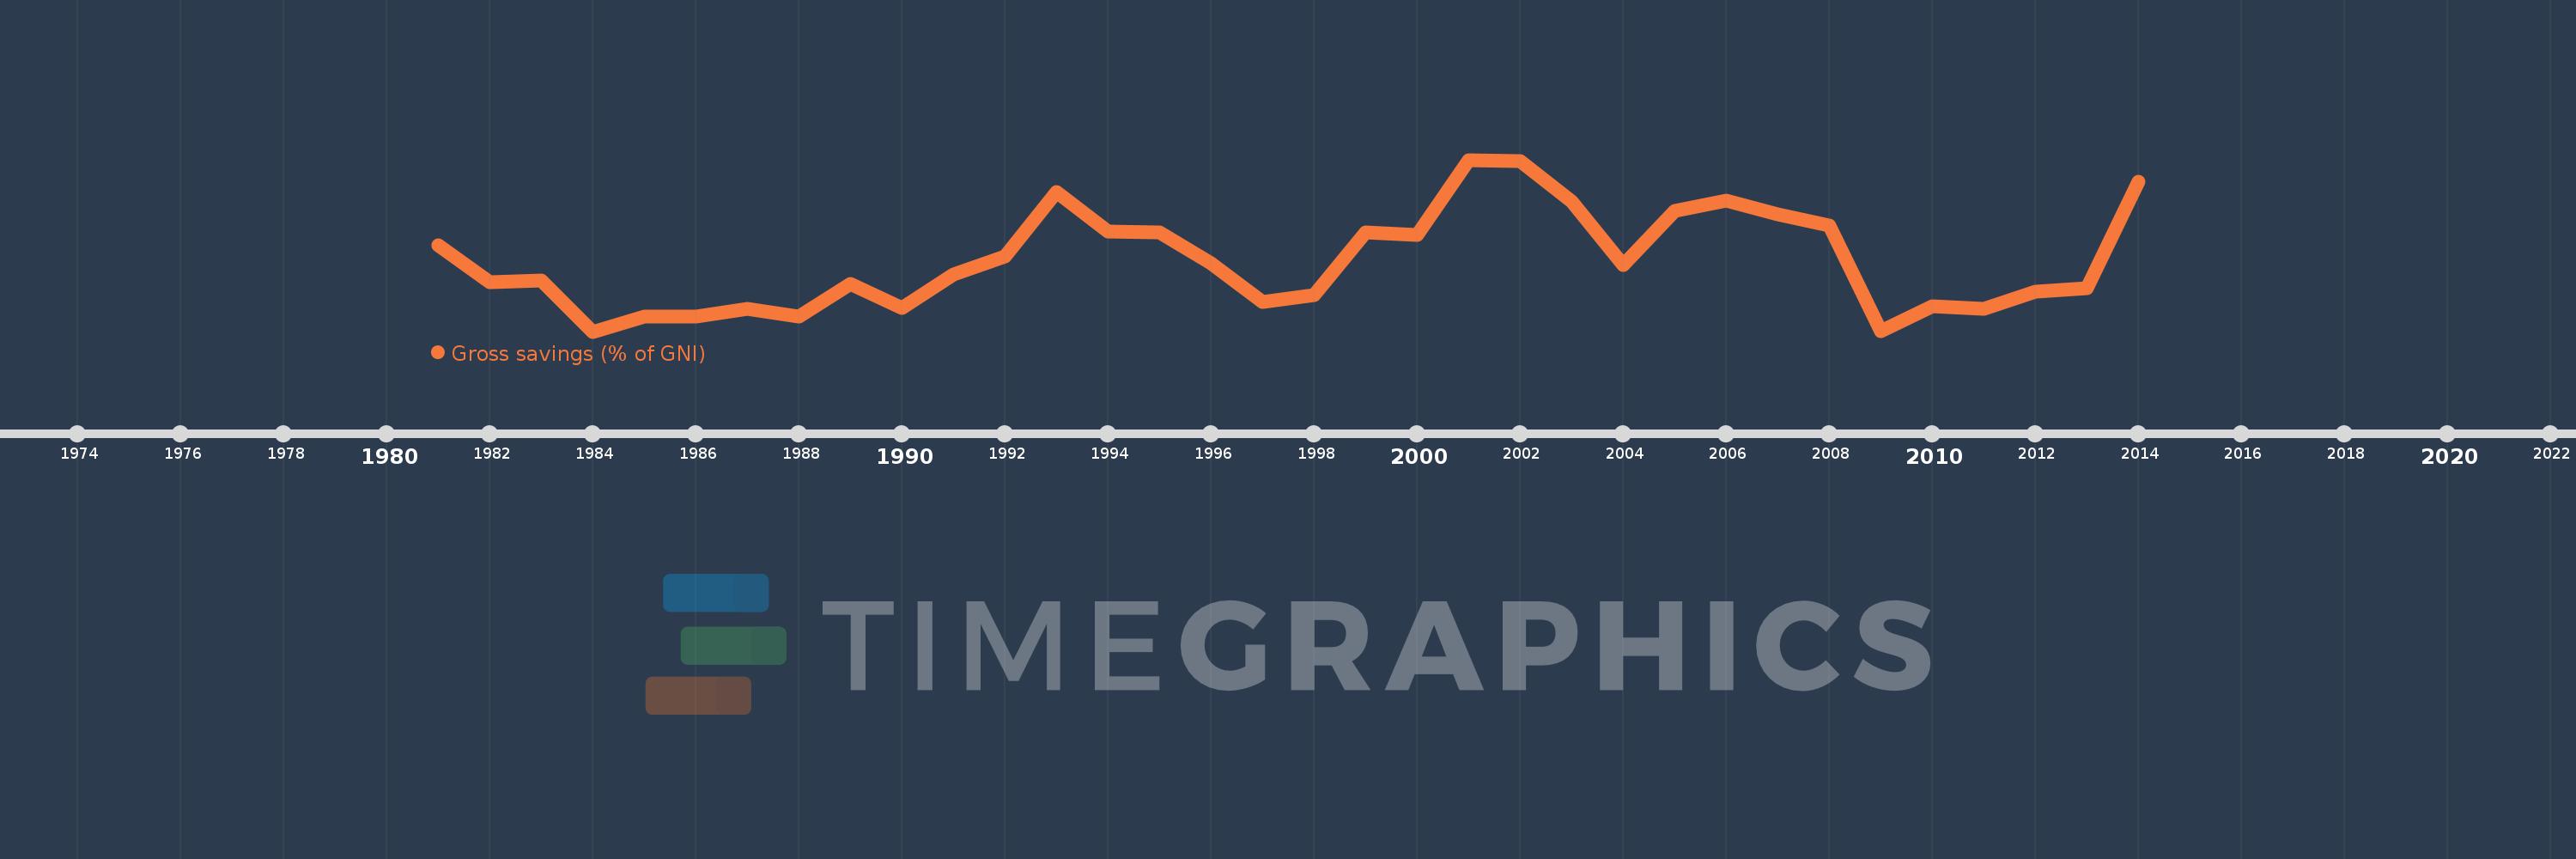
Gross savings (% of GNI)
2014,2013,2012,2011,2010,2009,2008,2007,2006,2005,2004,2003,2002,2001,2000,1999,1998,1997,1996,1995,1994,1993,1992,1991,1990,1989,1988,1987,1986,1985,1984,1983,1982,1981
This statistics in other country:
AfghanistanAlbaniaAlgeriaAngolaAntigua and BarbudaArab WorldArgentinaArmeniaAustraliaAustriaAzerbaijanBahamas, TheBahrainBangladeshBarbadosBelarusBelgiumBelizeBeninBermudaBhutanBoliviaBosnia and HerzegovinaBotswanaBrazilBrunei DarussalamBulgariaBurkina FasoBurundiCabo VerdeCambodiaCameroonCanadaCaribbean small statesCentral African RepublicCentral Europe and the BalticsChadChileChinaColombiaComorosCongo, Dem. Rep.Congo, Rep.Costa RicaCote d'IvoireCroatiaCyprusCzech RepublicDenmarkDjiboutiDominicaDominican RepublicEarly-demographic dividendEast Asia & PacificEast Asia & Pacific (excluding high income)East Asia & Pacific (IDA & IBRD countries)EcuadorEgypt, Arab Rep.El SalvadorEquatorial GuineaEritreaEstoniaEthiopiaEuro areaEurope & Central AsiaEurope & Central Asia (excluding high income)Europe & Central Asia (IDA & IBRD countries)European UnionFaroe IslandsFijiFinlandFragile and conflict affected situationsFranceGabonGambia, TheGeorgiaGermanyGhanaGreeceGrenadaGuatemalaGuineaGuinea-BissauGuyanaHaitiHeavily indebted poor countries (HIPC)High incomeHondurasHong Kong SAR, ChinaHungaryIBRD onlyIcelandIDA & IBRD totalIDA blendIDA onlyIDA totalIndiaIndonesiaIran, Islamic Rep.IraqIrelandIsraelItalyJamaicaJapanJordanKazakhstanKenyaKiribatiKorea, Rep.KosovoKuwaitKyrgyz RepublicLao PDRLate-demographic dividendLatin America & Caribbean Latin America & Caribbean (excluding high income)Latin America & the Caribbean (IDA & IBRD countries)LatviaLeast developed countries: UN classificationLebanonLesothoLiberiaLibyaLithuaniaLow & middle incomeLow incomeLower middle incomeLuxembourgMacao SAR, ChinaMacedonia, FYRMadagascarMalawiMalaysiaMaldivesMaliMaltaMauritaniaMauritiusMexicoMiddle East & North AfricaMiddle East & North Africa (excluding high income)Middle East & North Africa (IDA & IBRD countries)Middle incomeMoldovaMongoliaMontenegroMoroccoMozambiqueNamibiaNepalNetherlandsNew ZealandNicaraguaNigerNigeriaNorth AmericaNorwayOECD membersOmanOther small statesPacific island small statesPakistanPanamaPapua New GuineaParaguayPeruPhilippinesPolandPortugalPost-demographic dividendPre-demographic dividendQatarRomaniaRussian FederationRwandaSaudi ArabiaSenegalSerbiaSeychellesSierra LeoneSingaporeSlovak RepublicSloveniaSmall statesSolomon IslandsSouth AfricaSouth AsiaSouth Asia (IDA & IBRD)South SudanSpainSri LankaSt. Kitts and NevisSt. LuciaSt. Vincent and the GrenadinesSub-Saharan Africa Sub-Saharan Africa (excluding high income)Sub-Saharan Africa (IDA & IBRD countries)SudanSurinameSwazilandSwedenSwitzerlandSyrian Arab RepublicTajikistanTanzaniaThailandTimor-LesteTogoTongaTrinidad and TobagoTunisiaTurkeyUgandaUkraineUnited KingdomUnited StatesUpper middle incomeUruguayVanuatuVenezuela, RBVietnamWest Bank and GazaWorldYemen, Rep.ZambiaZimbabwe Timeline:
This timeline shows a graph from 1981 to 2014 of St. Kitts and Nevis. No data until 1980. Number of actual observations by date: 34.
Source name:
World Development Indicators
Source organization:
World Bank national accounts data, and OECD National Accounts data files.
Categories, topics:
Economy & Growth
Last updated:
apr 23, 2017
Indicators value changes by year
Minimum:
13.158
jan 1, 1984
Maximum:
38.479
jan 1, 2001
At the date of observation
Value
Absolute change
Change from previous value
jan 1, 1981
25.833
+25.833
0.0%
jan 1, 1982
20.47
-5.363
-20.76%
jan 1, 1983
20.661
+0.191
0.93%
jan 1, 1984
13.158
-7.503
-36.31%
jan 1, 1985
15.339
+2.181
16.57%
jan 1, 1986
15.414
+0.076
0.49%
jan 1, 1987
16.576
+1.162
7.54%
jan 1, 1988
15.399
-1.177
-7.1%
jan 1, 1989
20.205
+4.806
31.21%
jan 1, 1990
16.637
-3.568
-17.66%
jan 1, 1991
21.619
+4.982
29.95%
jan 1, 1992
24.297
+2.678
12.39%
jan 1, 1993
33.68
+9.383
38.62%
jan 1, 1994
27.96
-5.721
-16.98%
jan 1, 1995
27.813
-0.147
-0.53%
jan 1, 1996
23.214
-4.598
-16.53%
jan 1, 1997
17.494
-5.721
-24.64%
jan 1, 1998
18.553
+1.059
6.05%
jan 1, 1999
27.809
+9.256
49.89%
jan 1, 2000
27.376
-0.433
-1.56%
jan 1, 2001
38.479
+11.104
40.56%
jan 1, 2002
38.316
-0.163
-0.42%
jan 1, 2003
32.351
-5.965
-15.57%
jan 1, 2004
22.936
-9.414
-29.1%
jan 1, 2005
30.934
+7.997
34.87%
jan 1, 2006
32.414
+1.48
4.78%
jan 1, 2007
30.465
-1.949
-6.01%
jan 1, 2008
28.797
-1.667
-5.47%
jan 1, 2009
13.273
-15.524
-53.91%
jan 1, 2010
16.942
+3.669
27.64%
jan 1, 2011
16.478
-0.464
-2.74%
jan 1, 2012
18.989
+2.511
15.24%
jan 1, 2013
19.559
+0.57
3.0%
jan 1, 2014
35.215
+15.656
80.04%
Ranking of countries by current statistics by years


Comments: