29
/
en
AIzaSyAYiBZKx7MnpbEhh9jyipgxe19OcubqV5w
April 1, 2024
257380
Switzerland
CHE
true
2
1
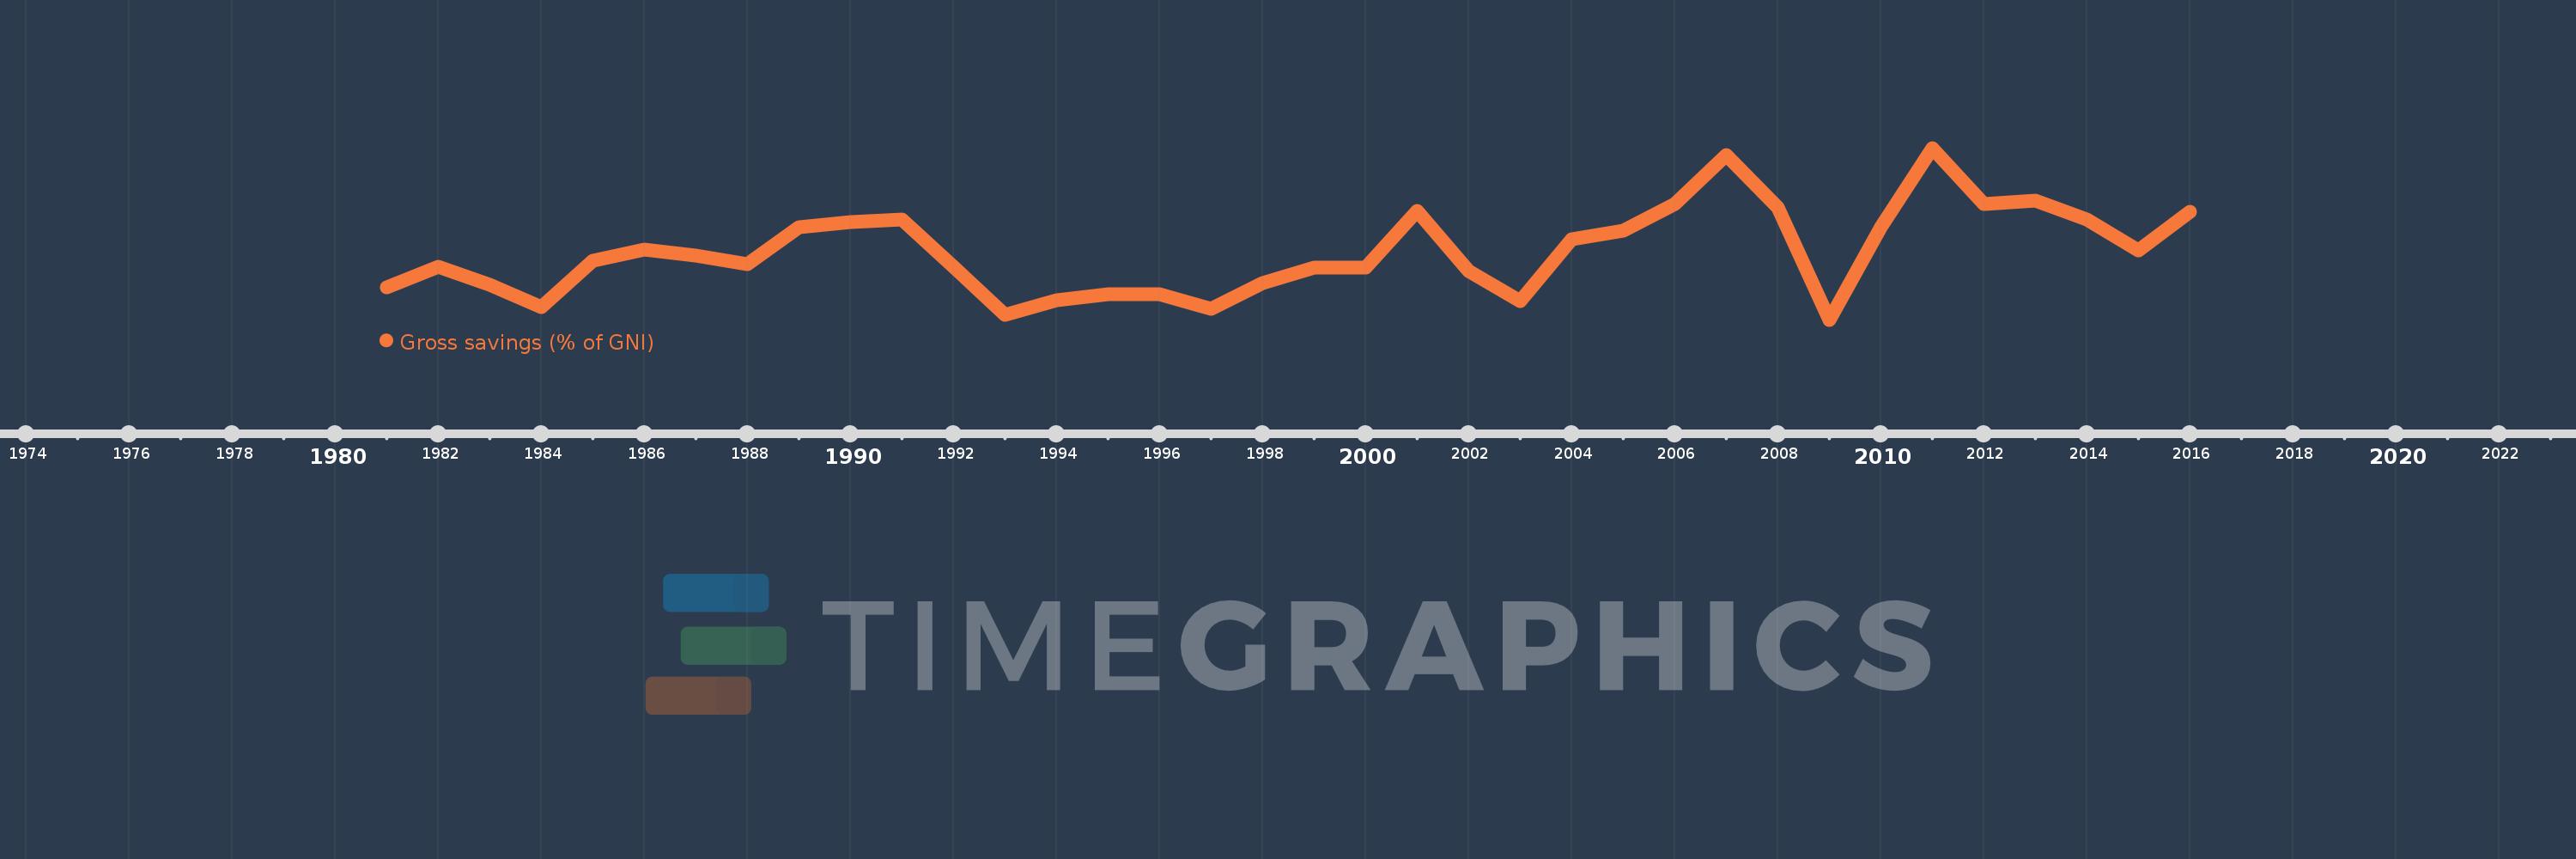
Gross savings (% of GNI)
2016,2015,2014,2013,2012,2011,2010,2009,2008,2007,2006,2005,2004,2003,2002,2001,2000,1999,1998,1997,1996,1995,1994,1993,1992,1991,1990,1989,1988,1987,1986,1985,1984,1983,1982,1981
This statistics in other country:
AfghanistanAlbaniaAlgeriaAngolaAntigua and BarbudaArab WorldArgentinaArmeniaAustraliaAustriaAzerbaijanBahamas, TheBahrainBangladeshBarbadosBelarusBelgiumBelizeBeninBermudaBhutanBoliviaBosnia and HerzegovinaBotswanaBrazilBrunei DarussalamBulgariaBurkina FasoBurundiCabo VerdeCambodiaCameroonCanadaCaribbean small statesCentral African RepublicCentral Europe and the BalticsChadChileChinaColombiaComorosCongo, Dem. Rep.Congo, Rep.Costa RicaCote d'IvoireCroatiaCyprusCzech RepublicDenmarkDjiboutiDominicaDominican RepublicEarly-demographic dividendEast Asia & PacificEast Asia & Pacific (excluding high income)East Asia & Pacific (IDA & IBRD countries)EcuadorEgypt, Arab Rep.El SalvadorEquatorial GuineaEritreaEstoniaEthiopiaEuro areaEurope & Central AsiaEurope & Central Asia (excluding high income)Europe & Central Asia (IDA & IBRD countries)European UnionFaroe IslandsFijiFinlandFragile and conflict affected situationsFranceGabonGambia, TheGeorgiaGermanyGhanaGreeceGrenadaGuatemalaGuineaGuinea-BissauGuyanaHaitiHeavily indebted poor countries (HIPC)High incomeHondurasHong Kong SAR, ChinaHungaryIBRD onlyIcelandIDA & IBRD totalIDA blendIDA onlyIDA totalIndiaIndonesiaIran, Islamic Rep.IraqIrelandIsraelItalyJamaicaJapanJordanKazakhstanKenyaKiribatiKorea, Rep.KosovoKuwaitKyrgyz RepublicLao PDRLate-demographic dividendLatin America & Caribbean Latin America & Caribbean (excluding high income)Latin America & the Caribbean (IDA & IBRD countries)LatviaLeast developed countries: UN classificationLebanonLesothoLiberiaLibyaLithuaniaLow & middle incomeLow incomeLower middle incomeLuxembourgMacao SAR, ChinaMacedonia, FYRMadagascarMalawiMalaysiaMaldivesMaliMaltaMauritaniaMauritiusMexicoMiddle East & North AfricaMiddle East & North Africa (excluding high income)Middle East & North Africa (IDA & IBRD countries)Middle incomeMoldovaMongoliaMontenegroMoroccoMozambiqueNamibiaNepalNetherlandsNew ZealandNicaraguaNigerNigeriaNorth AmericaNorwayOECD membersOmanOther small statesPacific island small statesPakistanPanamaPapua New GuineaParaguayPeruPhilippinesPolandPortugalPost-demographic dividendPre-demographic dividendQatarRomaniaRussian FederationRwandaSaudi ArabiaSenegalSerbiaSeychellesSierra LeoneSingaporeSlovak RepublicSloveniaSmall statesSolomon IslandsSouth AfricaSouth AsiaSouth Asia (IDA & IBRD)South SudanSpainSri LankaSt. Kitts and NevisSt. LuciaSt. Vincent and the GrenadinesSub-Saharan Africa Sub-Saharan Africa (excluding high income)Sub-Saharan Africa (IDA & IBRD countries)SudanSurinameSwazilandSwedenSwitzerlandSyrian Arab RepublicTajikistanTanzaniaThailandTimor-LesteTogoTongaTrinidad and TobagoTunisiaTurkeyUgandaUkraineUnited KingdomUnited StatesUpper middle incomeUruguayVanuatuVenezuela, RBVietnamWest Bank and GazaWorldYemen, Rep.ZambiaZimbabwe Timeline:
This timeline shows a graph from 1981 to 2016 of Switzerland. No data until 1980. Number of actual observations by date: 36.
Source name:
World Development Indicators
Source organization:
World Bank national accounts data, and OECD National Accounts data files.
Categories, topics:
Economy & Growth
Last updated:
apr 23, 2017
Indicators value changes by year
Minimum:
29.808
jan 1, 2009
Maximum:
37.101
jan 1, 2011
At the date of observation
Value
Absolute change
Change from previous value
jan 1, 1981
31.18
+31.18
0.0%
jan 1, 1982
32.061
+0.881
2.82%
jan 1, 1983
31.281
-0.78
-2.43%
jan 1, 1984
30.34
-0.941
-3.01%
jan 1, 1985
32.302
+1.962
6.47%
jan 1, 1986
32.804
+0.502
1.55%
jan 1, 1987
32.525
-0.279
-0.85%
jan 1, 1988
32.176
-0.35
-1.07%
jan 1, 1989
33.741
+1.566
4.87%
jan 1, 1990
33.949
+0.208
0.62%
jan 1, 1991
34.053
+0.103
0.3%
jan 1, 1992
32.048
-2.005
-5.89%
jan 1, 1993
30.012
-2.036
-6.35%
jan 1, 1994
30.64
+0.628
2.09%
jan 1, 1995
30.899
+0.259
0.85%
jan 1, 1996
30.908
+0.009
0.03%
jan 1, 1997
30.273
-0.635
-2.06%
jan 1, 1998
31.382
+1.109
3.66%
jan 1, 1999
32.016
+0.634
2.02%
jan 1, 2000
32.034
+0.018
0.06%
jan 1, 2001
34.411
+2.376
7.42%
jan 1, 2002
31.87
-2.541
-7.38%
jan 1, 2003
30.603
-1.267
-3.98%
jan 1, 2004
33.208
+2.605
8.51%
jan 1, 2005
33.606
+0.399
1.2%
jan 1, 2006
34.735
+1.129
3.36%
jan 1, 2007
36.81
+2.075
5.97%
jan 1, 2008
34.584
-2.226
-6.05%
jan 1, 2009
29.808
-4.776
-13.81%
jan 1, 2010
33.74
+3.932
13.19%
jan 1, 2011
37.101
+3.361
9.96%
jan 1, 2012
34.729
-2.372
-6.39%
jan 1, 2013
34.865
+0.136
0.39%
jan 1, 2014
34.053
-0.812
-2.33%
jan 1, 2015
32.763
-1.289
-3.79%
jan 1, 2016
34.386
+1.622
4.95%
Ranking of countries by current statistics by years


Comments: