29
/
en
AIzaSyAYiBZKx7MnpbEhh9jyipgxe19OcubqV5w
April 1, 2024
54104
Pacific island small states
PSS
false
2
1
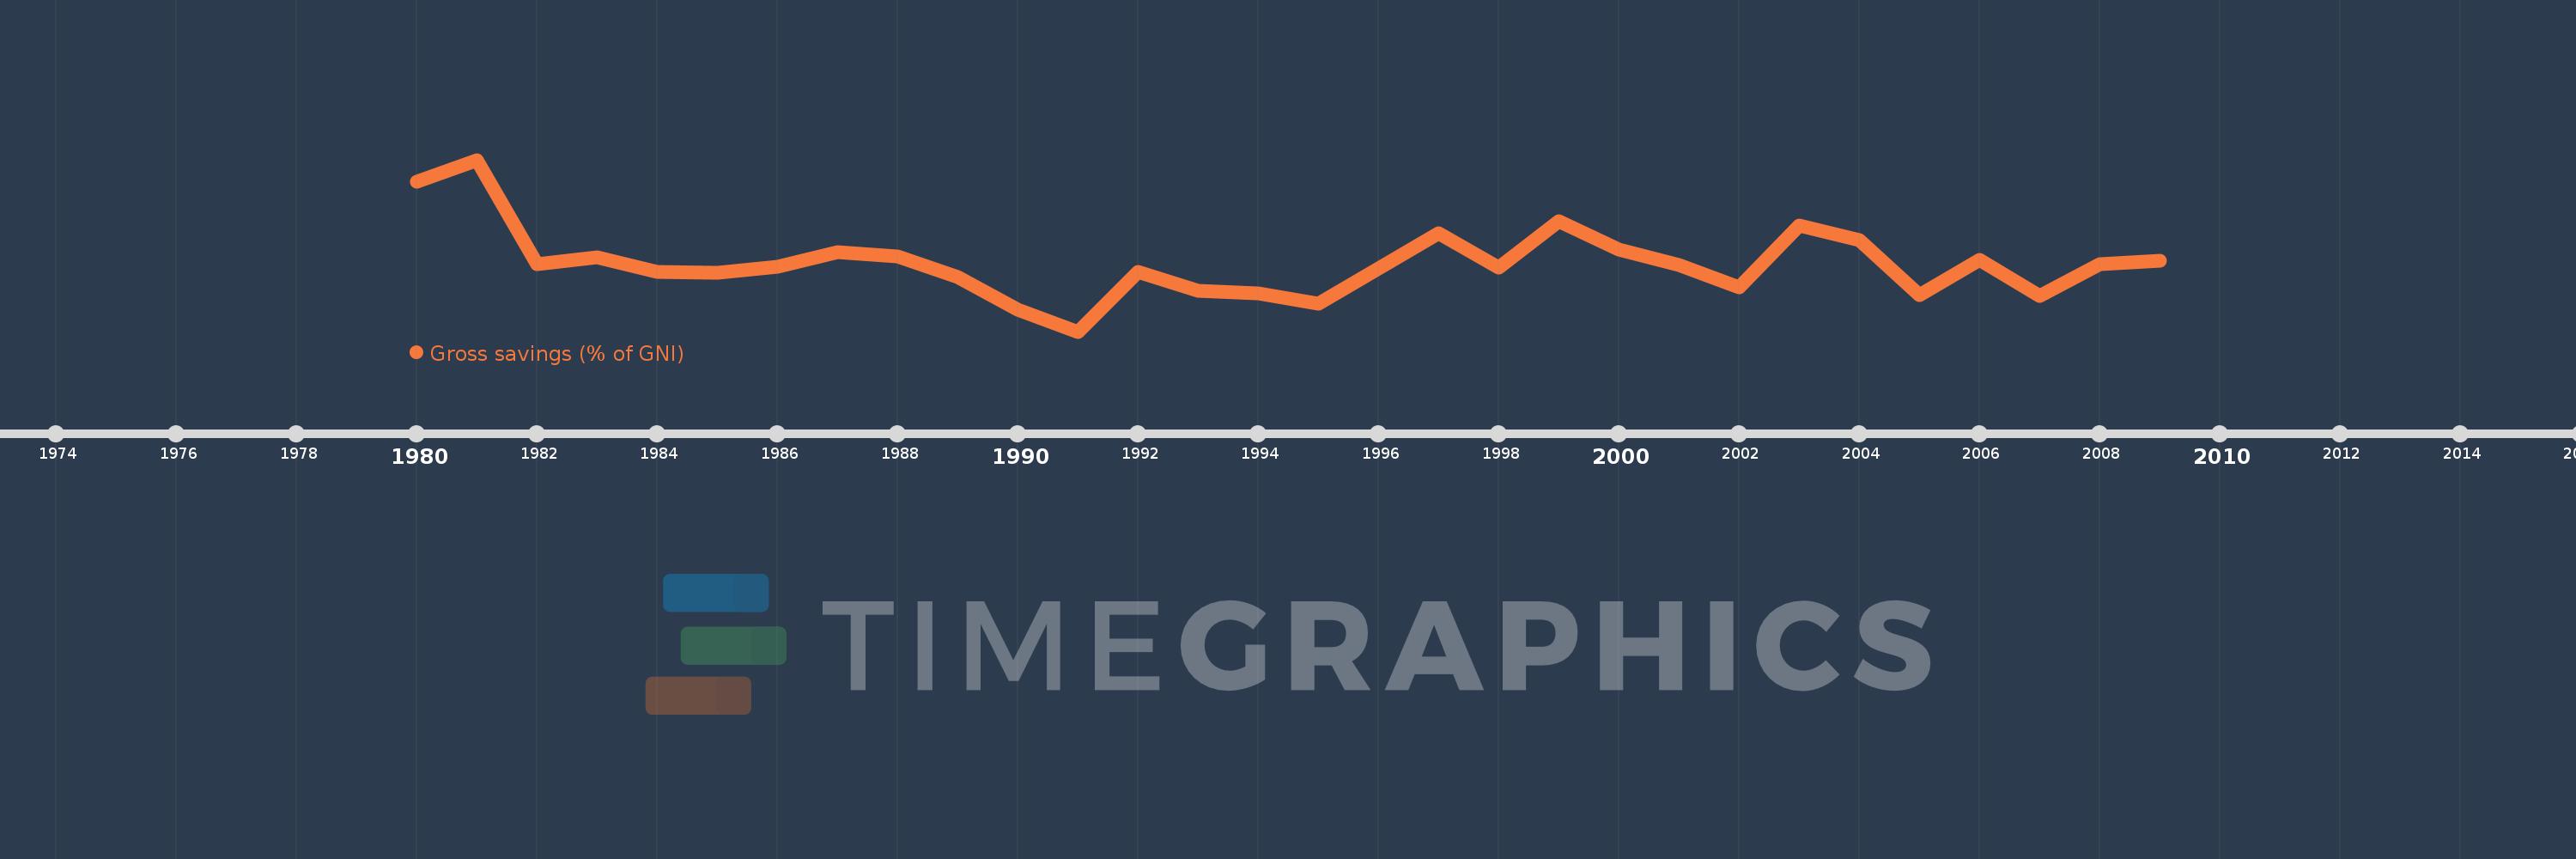
Gross savings (% of GNI)
2009,2008,2007,2006,2005,2004,2003,2002,2001,2000,1999,1998,1997,1995,1994,1993,1992,1991,1990,1989,1988,1987,1986,1985,1984,1983,1982,1981,1980
This statistics in other country:
AfghanistanAlbaniaAlgeriaAngolaAntigua and BarbudaArab WorldArgentinaArmeniaAustraliaAustriaAzerbaijanBahamas, TheBahrainBangladeshBarbadosBelarusBelgiumBelizeBeninBermudaBhutanBoliviaBosnia and HerzegovinaBotswanaBrazilBrunei DarussalamBulgariaBurkina FasoBurundiCabo VerdeCambodiaCameroonCanadaCaribbean small statesCentral African RepublicCentral Europe and the BalticsChadChileChinaColombiaComorosCongo, Dem. Rep.Congo, Rep.Costa RicaCote d'IvoireCroatiaCyprusCzech RepublicDenmarkDjiboutiDominicaDominican RepublicEarly-demographic dividendEast Asia & PacificEast Asia & Pacific (excluding high income)East Asia & Pacific (IDA & IBRD countries)EcuadorEgypt, Arab Rep.El SalvadorEquatorial GuineaEritreaEstoniaEthiopiaEuro areaEurope & Central AsiaEurope & Central Asia (excluding high income)Europe & Central Asia (IDA & IBRD countries)European UnionFaroe IslandsFijiFinlandFragile and conflict affected situationsFranceGabonGambia, TheGeorgiaGermanyGhanaGreeceGrenadaGuatemalaGuineaGuinea-BissauGuyanaHaitiHeavily indebted poor countries (HIPC)High incomeHondurasHong Kong SAR, ChinaHungaryIBRD onlyIcelandIDA & IBRD totalIDA blendIDA onlyIDA totalIndiaIndonesiaIran, Islamic Rep.IraqIrelandIsraelItalyJamaicaJapanJordanKazakhstanKenyaKiribatiKorea, Rep.KosovoKuwaitKyrgyz RepublicLao PDRLate-demographic dividendLatin America & Caribbean Latin America & Caribbean (excluding high income)Latin America & the Caribbean (IDA & IBRD countries)LatviaLeast developed countries: UN classificationLebanonLesothoLiberiaLibyaLithuaniaLow & middle incomeLow incomeLower middle incomeLuxembourgMacao SAR, ChinaMacedonia, FYRMadagascarMalawiMalaysiaMaldivesMaliMaltaMauritaniaMauritiusMexicoMiddle East & North AfricaMiddle East & North Africa (excluding high income)Middle East & North Africa (IDA & IBRD countries)Middle incomeMoldovaMongoliaMontenegroMoroccoMozambiqueNamibiaNepalNetherlandsNew ZealandNicaraguaNigerNigeriaNorth AmericaNorwayOECD membersOmanOther small statesPacific island small statesPakistanPanamaPapua New GuineaParaguayPeruPhilippinesPolandPortugalPost-demographic dividendPre-demographic dividendQatarRomaniaRussian FederationRwandaSaudi ArabiaSenegalSerbiaSeychellesSierra LeoneSingaporeSlovak RepublicSloveniaSmall statesSolomon IslandsSouth AfricaSouth AsiaSouth Asia (IDA & IBRD)South SudanSpainSri LankaSt. Kitts and NevisSt. LuciaSt. Vincent and the GrenadinesSub-Saharan Africa Sub-Saharan Africa (excluding high income)Sub-Saharan Africa (IDA & IBRD countries)SudanSurinameSwazilandSwedenSwitzerlandSyrian Arab RepublicTajikistanTanzaniaThailandTimor-LesteTogoTongaTrinidad and TobagoTunisiaTurkeyUgandaUkraineUnited KingdomUnited StatesUpper middle incomeUruguayVanuatuVenezuela, RBVietnamWest Bank and GazaWorldYemen, Rep.ZambiaZimbabwe Timeline:
This timeline shows a graph from 1980 to 2009 of Pacific island small states. No data until 1979. Number of actual observations by date: 29.
Source name:
World Development Indicators
Source organization:
World Bank national accounts data, and OECD National Accounts data files.
Categories, topics:
Economy & Growth
Last updated:
apr 23, 2017
Indicators value changes by year
Maximum:
30.336
jan 1, 1981
At the date of observation
Value
Absolute change
Change from previous value
jan 1, 1980
26.838
+26.838
0.0%
jan 1, 1981
30.336
+3.498
13.03%
jan 1, 1982
13.476
-16.861
-55.58%
jan 1, 1983
14.698
+1.222
9.07%
jan 1, 1984
12.289
-2.409
-16.39%
jan 1, 1985
12.191
-0.098
-0.8%
jan 1, 1986
13.129
+0.938
7.69%
jan 1, 1987
15.405
+2.277
17.34%
jan 1, 1988
14.751
-0.654
-4.25%
jan 1, 1989
11.472
-3.279
-22.23%
jan 1, 1990
6.227
-5.245
-45.72%
jan 1, 1991
2.675
-3.552
-57.04%
jan 1, 1992
12.245
+9.57
357.74%
jan 1, 1993
9.309
-2.936
-23.97%
jan 1, 1994
8.866
-0.443
-4.76%
jan 1, 1995
7.106
-1.76
-19.85%
jan 1, 1997
18.449
+11.343
159.61%
jan 1, 1998
13.024
-5.425
-29.41%
jan 1, 1999
20.407
+7.383
56.69%
jan 1, 2000
15.913
-4.494
-22.02%
jan 1, 2001
13.417
-2.496
-15.69%
jan 1, 2002
9.828
-3.589
-26.75%
jan 1, 2003
19.742
+9.914
100.88%
jan 1, 2004
17.359
-2.383
-12.07%
jan 1, 2005
8.526
-8.834
-50.89%
jan 1, 2006
14.224
+5.699
66.84%
jan 1, 2007
8.437
-5.787
-40.68%
jan 1, 2008
13.494
+5.057
59.93%
jan 1, 2009
14.096
+0.602
4.46%
Ranking of countries by current statistics by years


Comments: