29
/
en
AIzaSyAYiBZKx7MnpbEhh9jyipgxe19OcubqV5w
April 1, 2024
191477
Malta
MLT
true
2
1
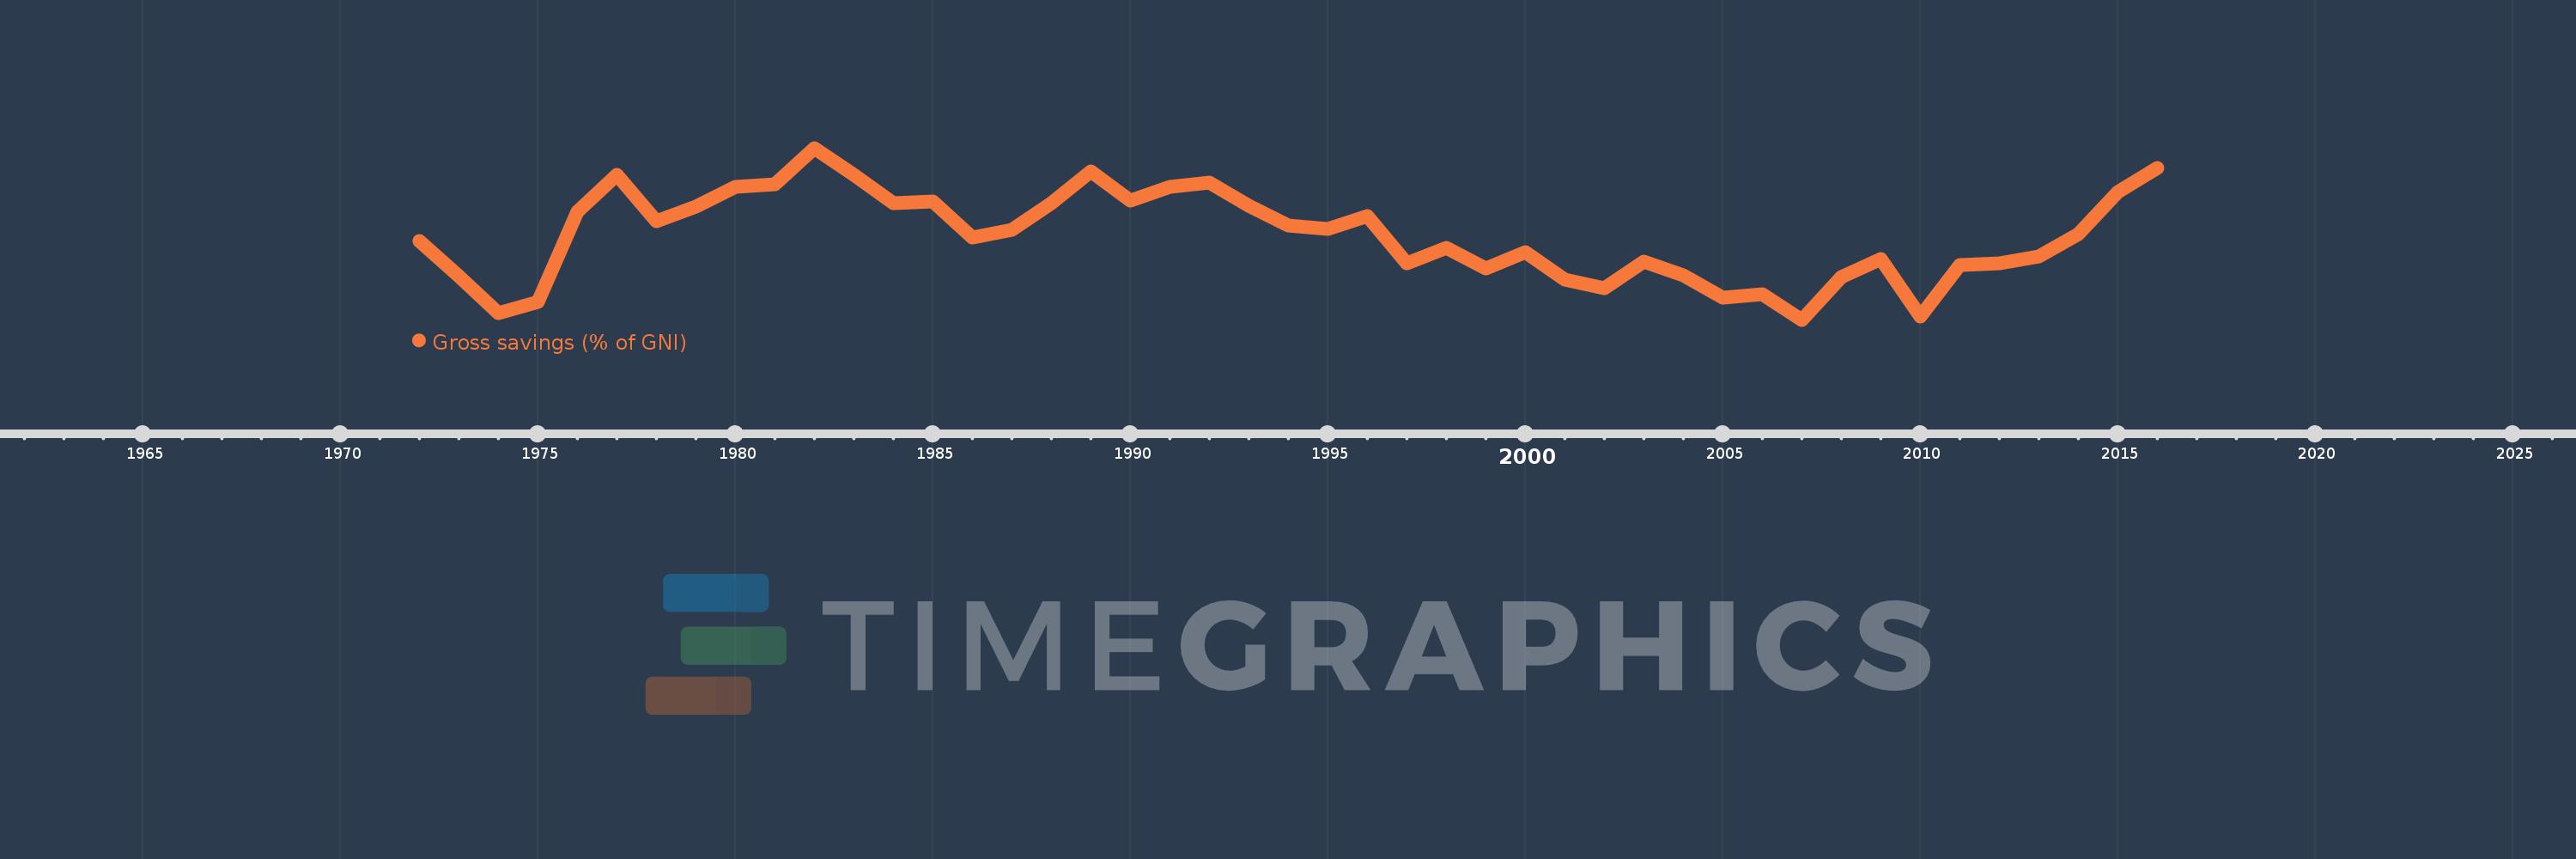
Gross savings (% of GNI)
2016,2015,2014,2013,2012,2011,2010,2009,2008,2007,2006,2005,2004,2003,2002,2001,2000,1999,1998,1997,1996,1995,1994,1993,1992,1991,1990,1989,1988,1987,1986,1985,1984,1983,1982,1981,1980,1979,1978,1977,1976,1975,1974,1973,1972
This statistics in other country:
AfghanistanAlbaniaAlgeriaAngolaAntigua and BarbudaArab WorldArgentinaArmeniaAustraliaAustriaAzerbaijanBahamas, TheBahrainBangladeshBarbadosBelarusBelgiumBelizeBeninBermudaBhutanBoliviaBosnia and HerzegovinaBotswanaBrazilBrunei DarussalamBulgariaBurkina FasoBurundiCabo VerdeCambodiaCameroonCanadaCaribbean small statesCentral African RepublicCentral Europe and the BalticsChadChileChinaColombiaComorosCongo, Dem. Rep.Congo, Rep.Costa RicaCote d'IvoireCroatiaCyprusCzech RepublicDenmarkDjiboutiDominicaDominican RepublicEarly-demographic dividendEast Asia & PacificEast Asia & Pacific (excluding high income)East Asia & Pacific (IDA & IBRD countries)EcuadorEgypt, Arab Rep.El SalvadorEquatorial GuineaEritreaEstoniaEthiopiaEuro areaEurope & Central AsiaEurope & Central Asia (excluding high income)Europe & Central Asia (IDA & IBRD countries)European UnionFaroe IslandsFijiFinlandFragile and conflict affected situationsFranceGabonGambia, TheGeorgiaGermanyGhanaGreeceGrenadaGuatemalaGuineaGuinea-BissauGuyanaHaitiHeavily indebted poor countries (HIPC)High incomeHondurasHong Kong SAR, ChinaHungaryIBRD onlyIcelandIDA & IBRD totalIDA blendIDA onlyIDA totalIndiaIndonesiaIran, Islamic Rep.IraqIrelandIsraelItalyJamaicaJapanJordanKazakhstanKenyaKiribatiKorea, Rep.KosovoKuwaitKyrgyz RepublicLao PDRLate-demographic dividendLatin America & Caribbean Latin America & Caribbean (excluding high income)Latin America & the Caribbean (IDA & IBRD countries)LatviaLeast developed countries: UN classificationLebanonLesothoLiberiaLibyaLithuaniaLow & middle incomeLow incomeLower middle incomeLuxembourgMacao SAR, ChinaMacedonia, FYRMadagascarMalawiMalaysiaMaldivesMaliMaltaMauritaniaMauritiusMexicoMiddle East & North AfricaMiddle East & North Africa (excluding high income)Middle East & North Africa (IDA & IBRD countries)Middle incomeMoldovaMongoliaMontenegroMoroccoMozambiqueNamibiaNepalNetherlandsNew ZealandNicaraguaNigerNigeriaNorth AmericaNorwayOECD membersOmanOther small statesPacific island small statesPakistanPanamaPapua New GuineaParaguayPeruPhilippinesPolandPortugalPost-demographic dividendPre-demographic dividendQatarRomaniaRussian FederationRwandaSaudi ArabiaSenegalSerbiaSeychellesSierra LeoneSingaporeSlovak RepublicSloveniaSmall statesSolomon IslandsSouth AfricaSouth AsiaSouth Asia (IDA & IBRD)South SudanSpainSri LankaSt. Kitts and NevisSt. LuciaSt. Vincent and the GrenadinesSub-Saharan Africa Sub-Saharan Africa (excluding high income)Sub-Saharan Africa (IDA & IBRD countries)SudanSurinameSwazilandSwedenSwitzerlandSyrian Arab RepublicTajikistanTanzaniaThailandTimor-LesteTogoTongaTrinidad and TobagoTunisiaTurkeyUgandaUkraineUnited KingdomUnited StatesUpper middle incomeUruguayVanuatuVenezuela, RBVietnamWest Bank and GazaWorldYemen, Rep.ZambiaZimbabwe Timeline:
This timeline shows a graph from 1972 to 2016 of Malta. No data until 1971. Number of actual observations by date: 45.
Source name:
World Development Indicators
Source organization:
World Bank national accounts data, and OECD National Accounts data files.
Categories, topics:
Economy & Growth
Last updated:
apr 23, 2017
Indicators value changes by year
Minimum:
14.648
jan 1, 2007
Maximum:
30.286
jan 1, 1982
At the date of observation
Value
Absolute change
Change from previous value
jan 1, 1972
21.848
+21.848
0.0%
jan 1, 1973
18.637
-3.211
-14.7%
jan 1, 1974
15.23
-3.406
-18.28%
jan 1, 1975
16.257
+1.027
6.74%
jan 1, 1976
24.481
+8.224
50.59%
jan 1, 1977
27.851
+3.369
13.76%
jan 1, 1978
23.651
-4.2
-15.08%
jan 1, 1979
24.978
+1.327
5.61%
jan 1, 1980
26.779
+1.802
7.21%
jan 1, 1981
26.976
+0.197
0.74%
jan 1, 1982
30.286
+3.309
12.27%
jan 1, 1983
27.851
-2.435
-8.04%
jan 1, 1984
25.289
-2.562
-9.2%
jan 1, 1985
25.414
+0.125
0.5%
jan 1, 1986
22.122
-3.293
-12.96%
jan 1, 1987
22.809
+0.687
3.11%
jan 1, 1988
25.232
+2.423
10.62%
jan 1, 1989
28.156
+2.924
11.59%
jan 1, 1990
25.456
-2.7
-9.59%
jan 1, 1991
26.743
+1.286
5.05%
jan 1, 1992
27.163
+0.42
1.57%
jan 1, 1993
25.021
-2.141
-7.88%
jan 1, 1994
23.253
-1.769
-7.07%
jan 1, 1995
22.921
-0.332
-1.43%
jan 1, 1996
24.066
+1.145
4.99%
jan 1, 1997
19.76
-4.305
-17.89%
jan 1, 1998
21.22
+1.46
7.39%
jan 1, 1999
19.331
-1.889
-8.9%
jan 1, 2000
20.817
+1.486
7.68%
jan 1, 2001
18.29
-2.527
-12.14%
jan 1, 2002
17.502
-0.789
-4.31%
jan 1, 2003
19.949
+2.448
13.98%
jan 1, 2004
18.686
-1.263
-6.33%
jan 1, 2005
16.623
-2.063
-11.04%
jan 1, 2006
16.933
+0.31
1.87%
jan 1, 2007
14.648
-2.285
-13.5%
jan 1, 2008
18.517
+3.87
26.42%
jan 1, 2009
20.212
+1.695
9.15%
jan 1, 2010
14.975
-5.237
-25.91%
jan 1, 2011
19.646
+4.67
31.19%
jan 1, 2012
19.764
+0.118
0.6%
jan 1, 2013
20.405
+0.641
3.24%
jan 1, 2014
22.427
+2.022
9.91%
jan 1, 2015
26.27
+3.843
17.14%
jan 1, 2016
28.488
+2.217
8.44%
Ranking of countries by current statistics by years


Comments: