29
/
en
AIzaSyAYiBZKx7MnpbEhh9jyipgxe19OcubqV5w
April 1, 2024
45136
Low & middle income
LMY
false
2
1
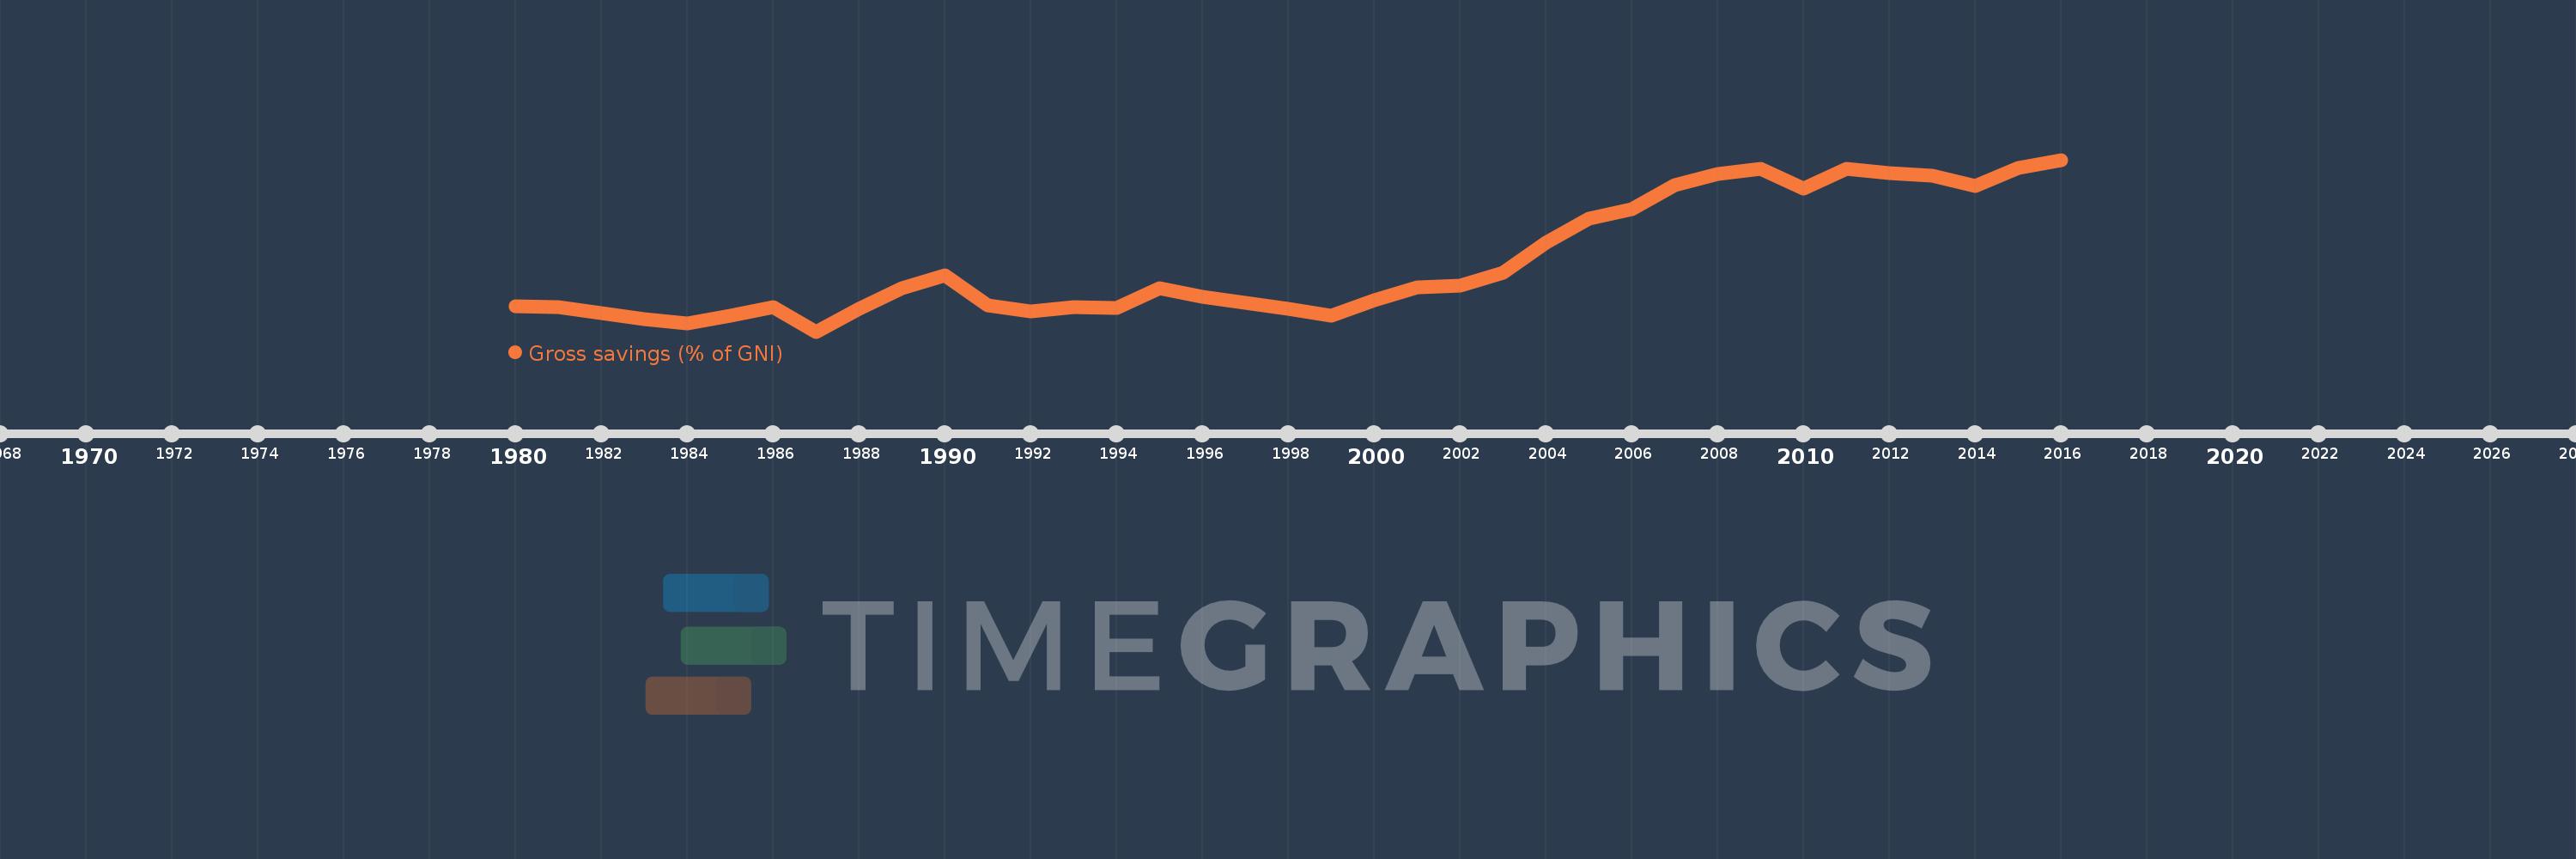
Gross savings (% of GNI)
2016,2015,2014,2013,2012,2011,2010,2009,2008,2007,2006,2005,2004,2003,2002,2001,2000,1999,1998,1997,1996,1995,1994,1993,1992,1991,1990,1989,1988,1987,1986,1985,1984,1983,1982,1981,1980
This statistics in other country:
AfghanistanAlbaniaAlgeriaAngolaAntigua and BarbudaArab WorldArgentinaArmeniaAustraliaAustriaAzerbaijanBahamas, TheBahrainBangladeshBarbadosBelarusBelgiumBelizeBeninBermudaBhutanBoliviaBosnia and HerzegovinaBotswanaBrazilBrunei DarussalamBulgariaBurkina FasoBurundiCabo VerdeCambodiaCameroonCanadaCaribbean small statesCentral African RepublicCentral Europe and the BalticsChadChileChinaColombiaComorosCongo, Dem. Rep.Congo, Rep.Costa RicaCote d'IvoireCroatiaCyprusCzech RepublicDenmarkDjiboutiDominicaDominican RepublicEarly-demographic dividendEast Asia & PacificEast Asia & Pacific (excluding high income)East Asia & Pacific (IDA & IBRD countries)EcuadorEgypt, Arab Rep.El SalvadorEquatorial GuineaEritreaEstoniaEthiopiaEuro areaEurope & Central AsiaEurope & Central Asia (excluding high income)Europe & Central Asia (IDA & IBRD countries)European UnionFaroe IslandsFijiFinlandFragile and conflict affected situationsFranceGabonGambia, TheGeorgiaGermanyGhanaGreeceGrenadaGuatemalaGuineaGuinea-BissauGuyanaHaitiHeavily indebted poor countries (HIPC)High incomeHondurasHong Kong SAR, ChinaHungaryIBRD onlyIcelandIDA & IBRD totalIDA blendIDA onlyIDA totalIndiaIndonesiaIran, Islamic Rep.IraqIrelandIsraelItalyJamaicaJapanJordanKazakhstanKenyaKiribatiKorea, Rep.KosovoKuwaitKyrgyz RepublicLao PDRLate-demographic dividendLatin America & Caribbean Latin America & Caribbean (excluding high income)Latin America & the Caribbean (IDA & IBRD countries)LatviaLeast developed countries: UN classificationLebanonLesothoLiberiaLibyaLithuaniaLow & middle incomeLow incomeLower middle incomeLuxembourgMacao SAR, ChinaMacedonia, FYRMadagascarMalawiMalaysiaMaldivesMaliMaltaMauritaniaMauritiusMexicoMiddle East & North AfricaMiddle East & North Africa (excluding high income)Middle East & North Africa (IDA & IBRD countries)Middle incomeMoldovaMongoliaMontenegroMoroccoMozambiqueNamibiaNepalNetherlandsNew ZealandNicaraguaNigerNigeriaNorth AmericaNorwayOECD membersOmanOther small statesPacific island small statesPakistanPanamaPapua New GuineaParaguayPeruPhilippinesPolandPortugalPost-demographic dividendPre-demographic dividendQatarRomaniaRussian FederationRwandaSaudi ArabiaSenegalSerbiaSeychellesSierra LeoneSingaporeSlovak RepublicSloveniaSmall statesSolomon IslandsSouth AfricaSouth AsiaSouth Asia (IDA & IBRD)South SudanSpainSri LankaSt. Kitts and NevisSt. LuciaSt. Vincent and the GrenadinesSub-Saharan Africa Sub-Saharan Africa (excluding high income)Sub-Saharan Africa (IDA & IBRD countries)SudanSurinameSwazilandSwedenSwitzerlandSyrian Arab RepublicTajikistanTanzaniaThailandTimor-LesteTogoTongaTrinidad and TobagoTunisiaTurkeyUgandaUkraineUnited KingdomUnited StatesUpper middle incomeUruguayVanuatuVenezuela, RBVietnamWest Bank and GazaWorldYemen, Rep.ZambiaZimbabwe Timeline:
This timeline shows a graph from 1980 to 2016 of Low & middle income. No data until 1979. Number of actual observations by date: 37.
Source name:
World Development Indicators
Source organization:
World Bank national accounts data, and OECD National Accounts data files.
Categories, topics:
Economy & Growth
Last updated:
apr 23, 2017
Indicators value changes by year
Minimum:
22.283
jan 1, 1987
Maximum:
34.674
jan 1, 2016
At the date of observation
Value
Absolute change
Change from previous value
jan 1, 1980
24.082
+24.082
0.0%
jan 1, 1981
24.057
-0.025
-0.1%
jan 1, 1982
23.592
-0.465
-1.93%
jan 1, 1983
23.155
-0.438
-1.85%
jan 1, 1984
22.888
-0.267
-1.15%
jan 1, 1985
23.422
+0.534
2.33%
jan 1, 1986
24.026
+0.604
2.58%
jan 1, 1987
22.283
-1.743
-7.26%
jan 1, 1988
23.927
+1.644
7.38%
jan 1, 1989
25.403
+1.476
6.17%
jan 1, 1990
26.366
+0.963
3.79%
jan 1, 1991
24.186
-2.18
-8.27%
jan 1, 1992
23.719
-0.466
-1.93%
jan 1, 1993
24.043
+0.324
1.36%
jan 1, 1994
23.958
-0.084
-0.35%
jan 1, 1995
25.397
+1.439
6.0%
jan 1, 1996
24.805
-0.592
-2.33%
jan 1, 1997
24.386
-0.419
-1.69%
jan 1, 1998
23.898
-0.488
-2.0%
jan 1, 1999
23.409
-0.49
-2.05%
jan 1, 2000
24.537
+1.128
4.82%
jan 1, 2001
25.451
+0.914
3.72%
jan 1, 2002
25.575
+0.125
0.49%
jan 1, 2003
26.509
+0.934
3.65%
jan 1, 2004
28.668
+2.158
8.14%
jan 1, 2005
30.428
+1.76
6.14%
jan 1, 2006
31.084
+0.656
2.16%
jan 1, 2007
32.82
+1.735
5.58%
jan 1, 2008
33.631
+0.811
2.47%
jan 1, 2009
34.034
+0.404
1.2%
jan 1, 2010
32.587
-1.448
-4.25%
jan 1, 2011
34.051
+1.464
4.49%
jan 1, 2012
33.693
-0.358
-1.05%
jan 1, 2013
33.542
-0.151
-0.45%
jan 1, 2014
32.769
-0.773
-2.31%
jan 1, 2015
34.08
+1.311
4.0%
jan 1, 2016
34.674
+0.595
1.75%
Ranking of countries by current statistics by years


Comments: