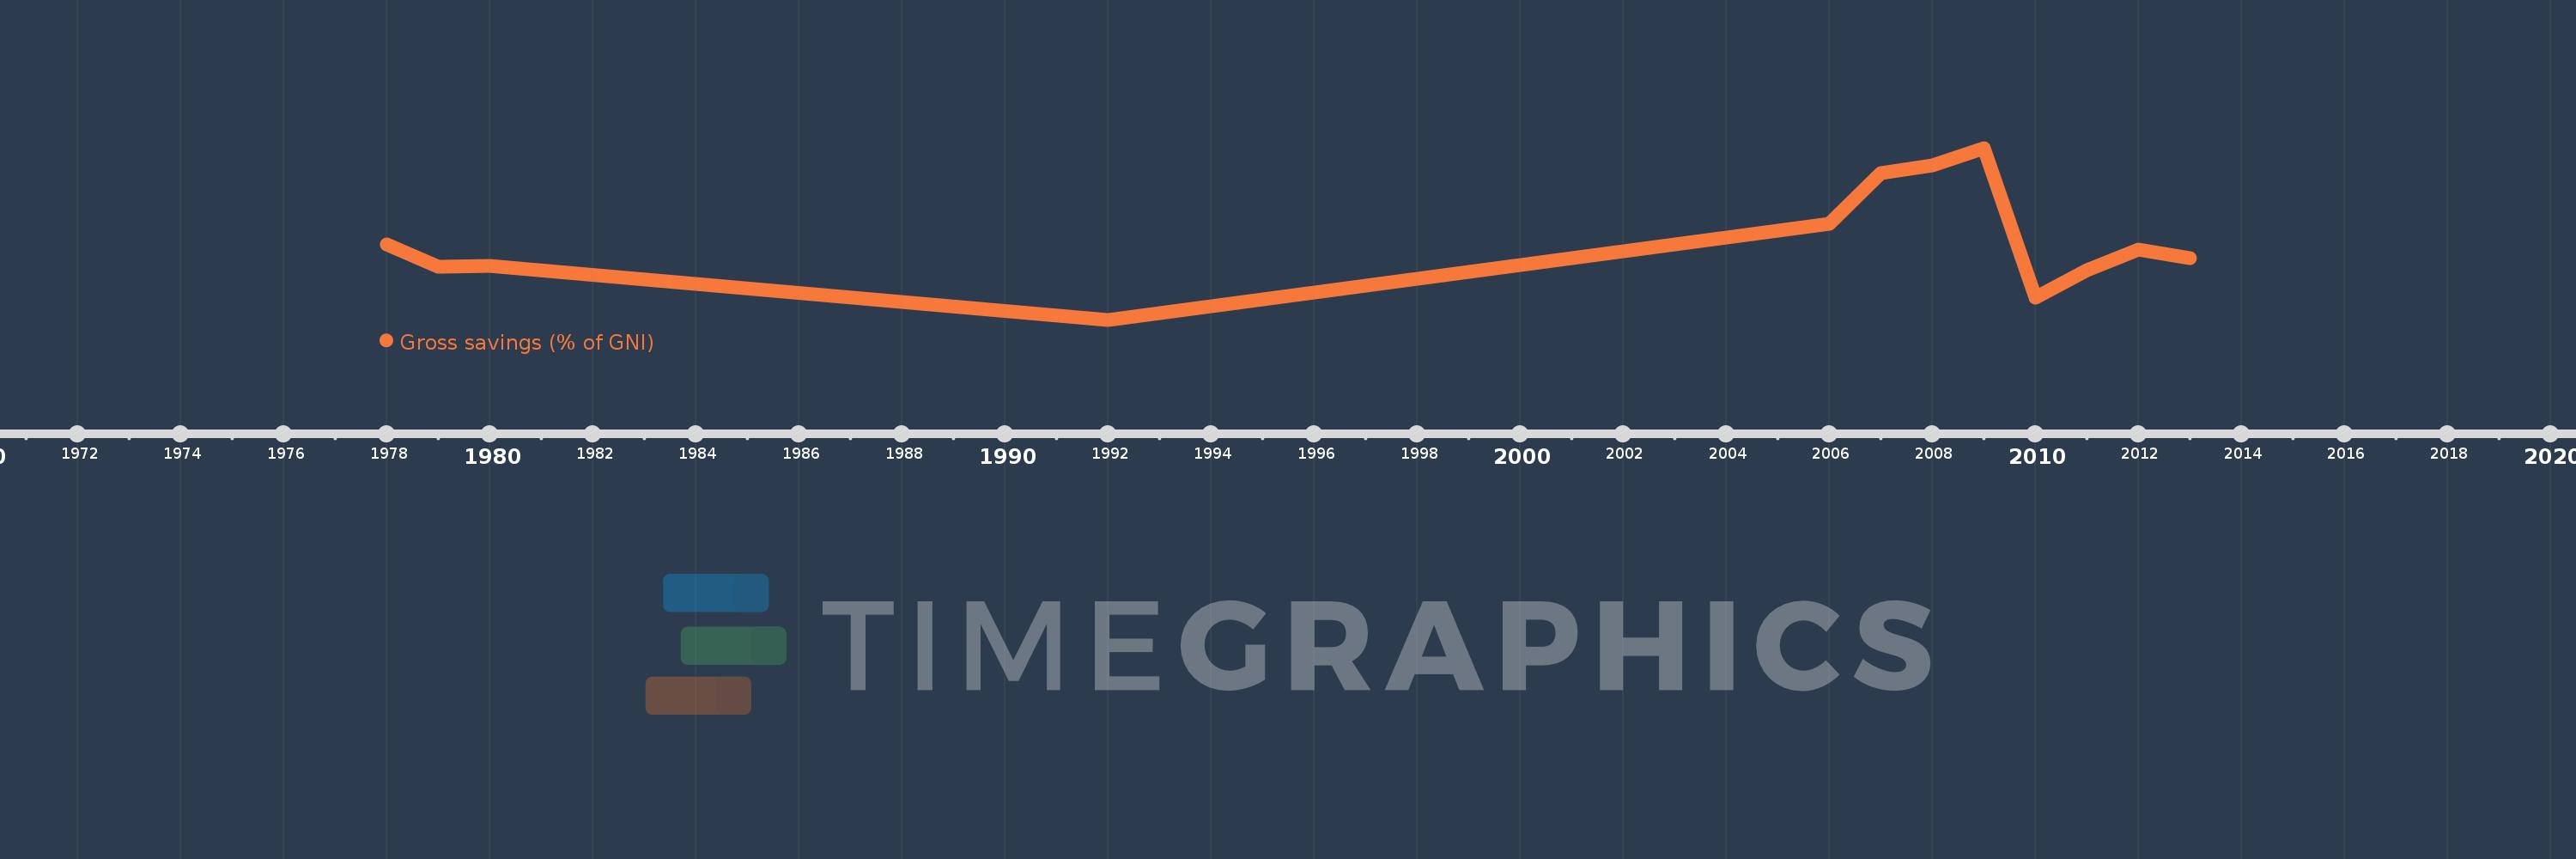
This timeline shows a graph from 1978 to 2013 of Fragile and conflict affected situations. No data until 1977. Number of actual observations by date: 12.
Source name:
World Development Indicators
Source organization:
World Bank national accounts data, and OECD National Accounts data files.
Categories, topics:
Economy & Growth
Last updated:
apr 23, 2017
Indicators value changes by year
Meaning:
19.419
Minimum:
7.853
jan 1, 1992
Maximum:
32.828
jan 1, 2009
At the date of observation
Value
Absolute change
Change from the previous value
jan 1, 1978
18.778
+18.778
0.0%
jan 1, 1979
15.576
-3.202
-17.05%
jan 1, 1980
15.678
+0.103
0.66%
jan 1, 1992
7.853
-7.826
-49.91%
jan 1, 2006
21.862
+14.01
178.41%
jan 1, 2007
29.16
+7.297
33.38%
jan 1, 2008
30.276
+1.117
3.83%
jan 1, 2009
32.828
+2.552
8.43%
jan 1, 2010
11.118
-21.71
-66.13%
jan 1, 2011
15.041
+3.923
35.29%
jan 1, 2012
17.996
+2.954
19.64%
jan 1, 2013
16.856
-1.14
-6.33%
Ranking of countries by current statistics by years
