29
/
en
AIzaSyAYiBZKx7MnpbEhh9jyipgxe19OcubqV5w
April 1, 2024
277750
Uruguay
URY
true
2
1
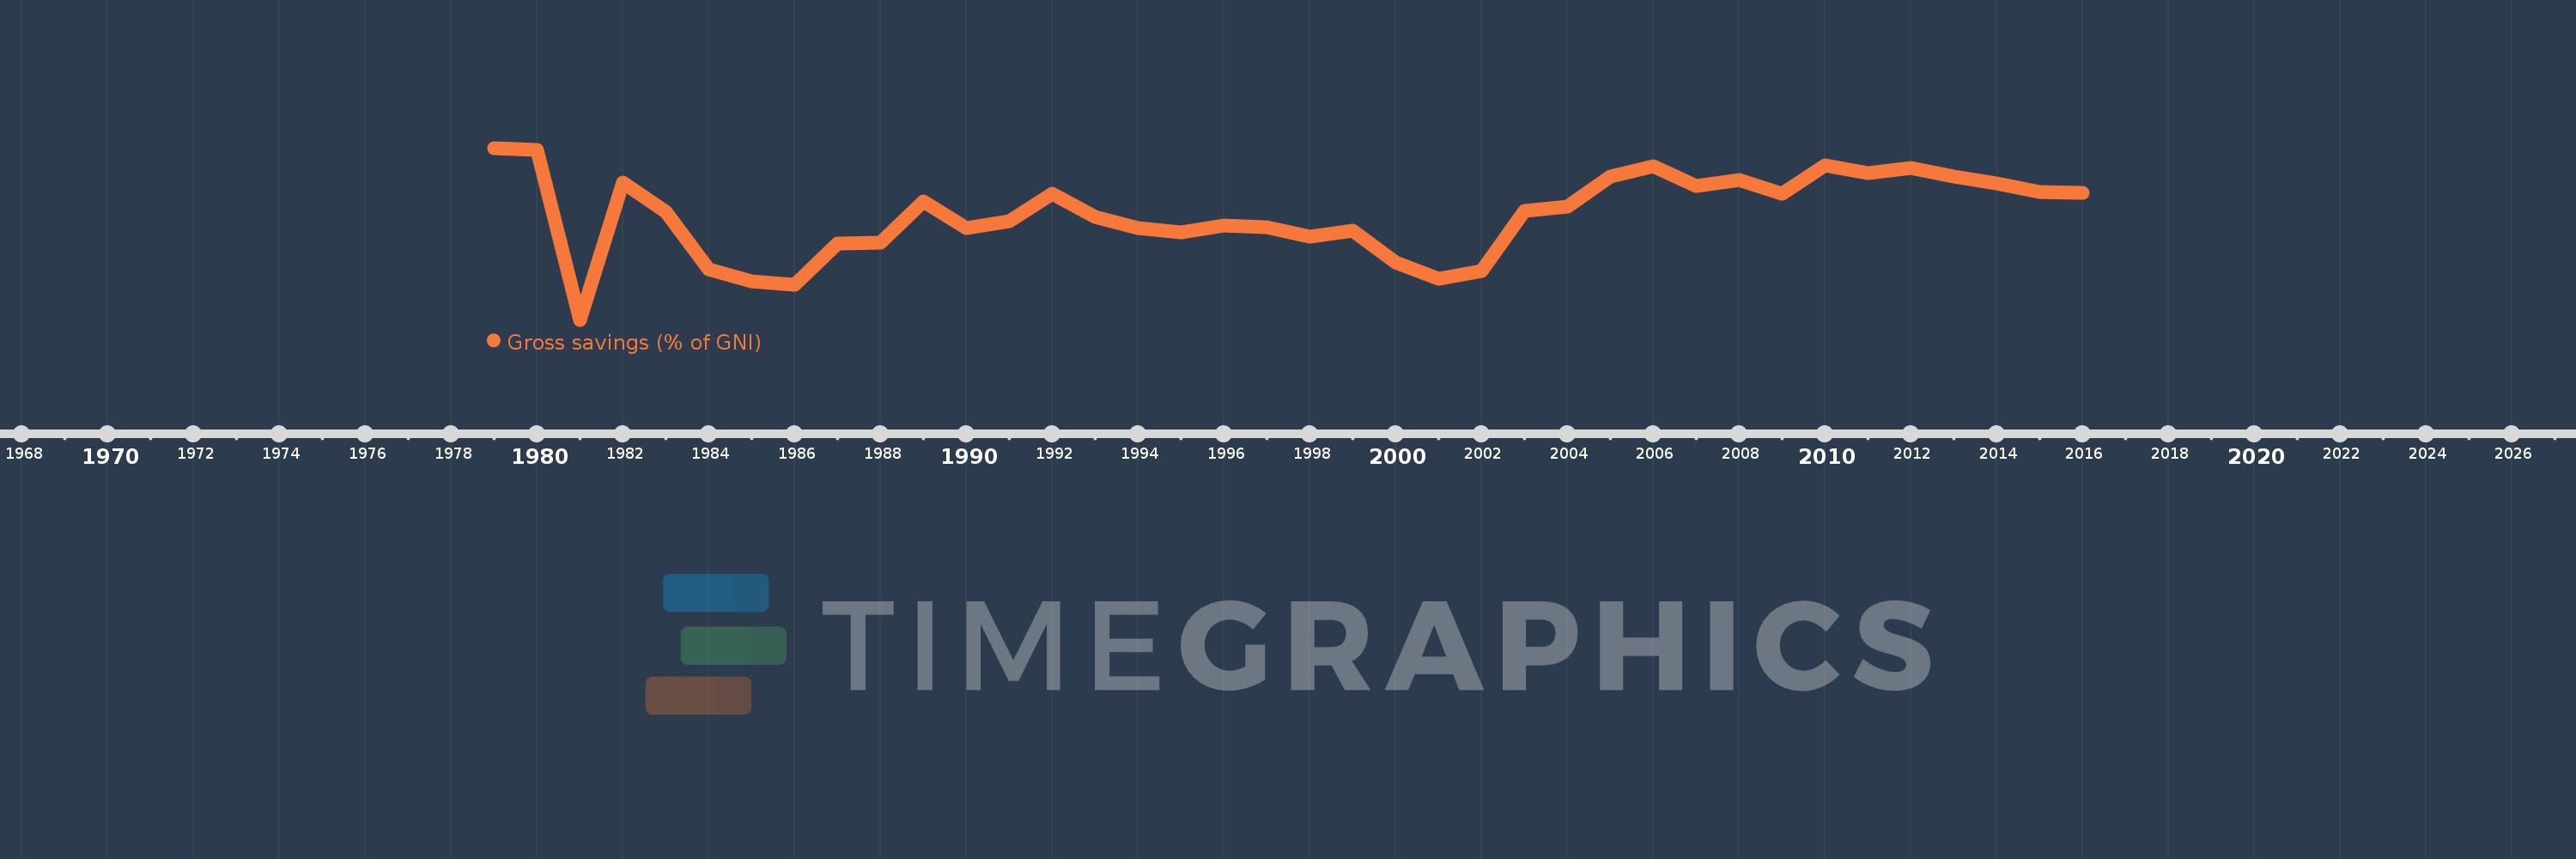
Gross savings (% of GNI)
2016,2015,2014,2013,2012,2011,2010,2009,2008,2007,2006,2005,2004,2003,2002,2001,2000,1999,1998,1997,1996,1995,1994,1993,1992,1991,1990,1989,1988,1987,1986,1985,1984,1983,1982,1981,1980,1979
This statistics in other country:
AfghanistanAlbaniaAlgeriaAngolaAntigua and BarbudaArab WorldArgentinaArmeniaAustraliaAustriaAzerbaijanBahamas, TheBahrainBangladeshBarbadosBelarusBelgiumBelizeBeninBermudaBhutanBoliviaBosnia and HerzegovinaBotswanaBrazilBrunei DarussalamBulgariaBurkina FasoBurundiCabo VerdeCambodiaCameroonCanadaCaribbean small statesCentral African RepublicCentral Europe and the BalticsChadChileChinaColombiaComorosCongo, Dem. Rep.Congo, Rep.Costa RicaCote d'IvoireCroatiaCyprusCzech RepublicDenmarkDjiboutiDominicaDominican RepublicEarly-demographic dividendEast Asia & PacificEast Asia & Pacific (excluding high income)East Asia & Pacific (IDA & IBRD countries)EcuadorEgypt, Arab Rep.El SalvadorEquatorial GuineaEritreaEstoniaEthiopiaEuro areaEurope & Central AsiaEurope & Central Asia (excluding high income)Europe & Central Asia (IDA & IBRD countries)European UnionFaroe IslandsFijiFinlandFragile and conflict affected situationsFranceGabonGambia, TheGeorgiaGermanyGhanaGreeceGrenadaGuatemalaGuineaGuinea-BissauGuyanaHaitiHeavily indebted poor countries (HIPC)High incomeHondurasHong Kong SAR, ChinaHungaryIBRD onlyIcelandIDA & IBRD totalIDA blendIDA onlyIDA totalIndiaIndonesiaIran, Islamic Rep.IraqIrelandIsraelItalyJamaicaJapanJordanKazakhstanKenyaKiribatiKorea, Rep.KosovoKuwaitKyrgyz RepublicLao PDRLate-demographic dividendLatin America & Caribbean Latin America & Caribbean (excluding high income)Latin America & the Caribbean (IDA & IBRD countries)LatviaLeast developed countries: UN classificationLebanonLesothoLiberiaLibyaLithuaniaLow & middle incomeLow incomeLower middle incomeLuxembourgMacao SAR, ChinaMacedonia, FYRMadagascarMalawiMalaysiaMaldivesMaliMaltaMauritaniaMauritiusMexicoMiddle East & North AfricaMiddle East & North Africa (excluding high income)Middle East & North Africa (IDA & IBRD countries)Middle incomeMoldovaMongoliaMontenegroMoroccoMozambiqueNamibiaNepalNetherlandsNew ZealandNicaraguaNigerNigeriaNorth AmericaNorwayOECD membersOmanOther small statesPacific island small statesPakistanPanamaPapua New GuineaParaguayPeruPhilippinesPolandPortugalPost-demographic dividendPre-demographic dividendQatarRomaniaRussian FederationRwandaSaudi ArabiaSenegalSerbiaSeychellesSierra LeoneSingaporeSlovak RepublicSloveniaSmall statesSolomon IslandsSouth AfricaSouth AsiaSouth Asia (IDA & IBRD)South SudanSpainSri LankaSt. Kitts and NevisSt. LuciaSt. Vincent and the GrenadinesSub-Saharan Africa Sub-Saharan Africa (excluding high income)Sub-Saharan Africa (IDA & IBRD countries)SudanSurinameSwazilandSwedenSwitzerlandSyrian Arab RepublicTajikistanTanzaniaThailandTimor-LesteTogoTongaTrinidad and TobagoTunisiaTurkeyUgandaUkraineUnited KingdomUnited StatesUpper middle incomeUruguayVanuatuVenezuela, RBVietnamWest Bank and GazaWorldYemen, Rep.ZambiaZimbabwe Timeline:
This timeline shows a graph from 1979 to 2016 of Uruguay. No data until 1978. Number of actual observations by date: 38.
Source name:
World Development Indicators
Source organization:
World Bank national accounts data, and OECD National Accounts data files.
Categories, topics:
Economy & Growth
Last updated:
apr 23, 2017
Indicators value changes by year
Maximum:
19.278
jan 1, 1979
At the date of observation
Value
Absolute change
Change from previous value
jan 1, 1979
19.278
+19.278
0.0%
jan 1, 1980
19.154
-0.124
-0.64%
jan 1, 1981
8.395
-10.758
-56.17%
jan 1, 1982
17.096
+8.701
103.64%
jan 1, 1983
15.211
-1.885
-11.03%
jan 1, 1984
11.577
-3.634
-23.89%
jan 1, 1985
10.829
-0.748
-6.46%
jan 1, 1986
10.622
-0.208
-1.92%
jan 1, 1987
13.238
+2.617
24.64%
jan 1, 1988
13.29
+0.052
0.39%
jan 1, 1989
15.884
+2.594
19.52%
jan 1, 1990
14.227
-1.657
-10.43%
jan 1, 1991
14.619
+0.392
2.76%
jan 1, 1992
16.351
+1.732
11.85%
jan 1, 1993
14.9
-1.451
-8.87%
jan 1, 1994
14.174
-0.727
-4.88%
jan 1, 1995
13.913
-0.261
-1.84%
jan 1, 1996
14.349
+0.436
3.14%
jan 1, 1997
14.267
-0.082
-0.57%
jan 1, 1998
13.674
-0.593
-4.16%
jan 1, 1999
14.059
+0.385
2.82%
jan 1, 2000
12.025
-2.034
-14.47%
jan 1, 2001
11.002
-1.024
-8.51%
jan 1, 2002
11.481
+0.48
4.36%
jan 1, 2003
15.297
+3.816
33.24%
jan 1, 2004
15.559
+0.262
1.71%
jan 1, 2005
17.478
+1.919
12.33%
jan 1, 2006
18.1
+0.622
3.56%
jan 1, 2007
16.875
-1.224
-6.76%
jan 1, 2008
17.253
+0.377
2.24%
jan 1, 2009
16.398
-0.854
-4.95%
jan 1, 2010
18.182
+1.784
10.88%
jan 1, 2011
17.672
-0.51
-2.81%
jan 1, 2012
18.018
+0.346
1.96%
jan 1, 2013
17.447
-0.571
-3.17%
jan 1, 2014
17.004
-0.444
-2.54%
jan 1, 2015
16.486
-0.518
-3.05%
jan 1, 2016
16.439
-0.047
-0.28%
Ranking of countries by current statistics by years


Comments: