29
/
en
AIzaSyAYiBZKx7MnpbEhh9jyipgxe19OcubqV5w
April 1, 2024
240519
Singapore
SGP
true
2
1
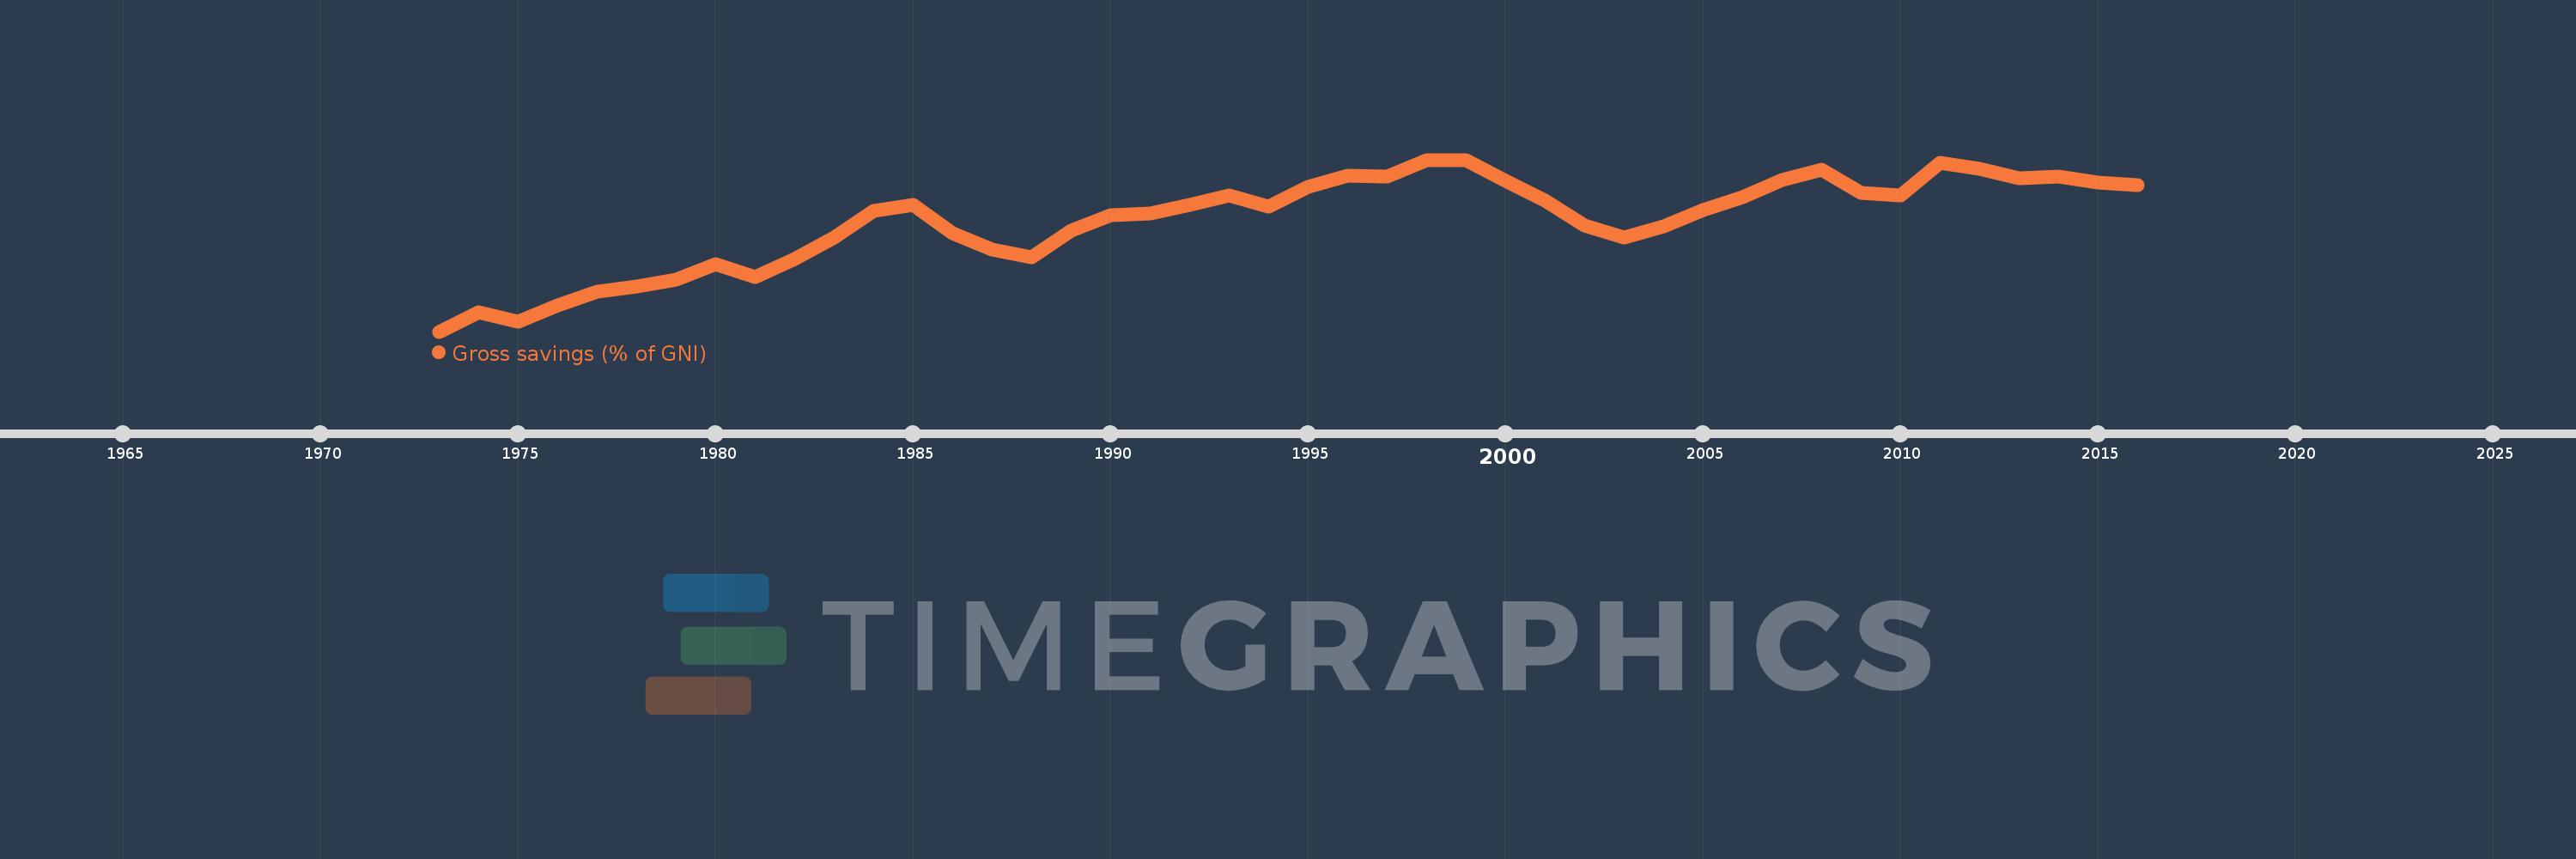
Gross savings (% of GNI)
2016,2015,2014,2013,2012,2011,2010,2009,2008,2007,2006,2005,2004,2003,2002,2001,2000,1999,1998,1997,1996,1995,1994,1993,1992,1991,1990,1989,1988,1987,1986,1985,1984,1983,1982,1981,1980,1979,1978,1977,1976,1975,1974,1973
This statistics in other country:
AfghanistanAlbaniaAlgeriaAngolaAntigua and BarbudaArab WorldArgentinaArmeniaAustraliaAustriaAzerbaijanBahamas, TheBahrainBangladeshBarbadosBelarusBelgiumBelizeBeninBermudaBhutanBoliviaBosnia and HerzegovinaBotswanaBrazilBrunei DarussalamBulgariaBurkina FasoBurundiCabo VerdeCambodiaCameroonCanadaCaribbean small statesCentral African RepublicCentral Europe and the BalticsChadChileChinaColombiaComorosCongo, Dem. Rep.Congo, Rep.Costa RicaCote d'IvoireCroatiaCyprusCzech RepublicDenmarkDjiboutiDominicaDominican RepublicEarly-demographic dividendEast Asia & PacificEast Asia & Pacific (excluding high income)East Asia & Pacific (IDA & IBRD countries)EcuadorEgypt, Arab Rep.El SalvadorEquatorial GuineaEritreaEstoniaEthiopiaEuro areaEurope & Central AsiaEurope & Central Asia (excluding high income)Europe & Central Asia (IDA & IBRD countries)European UnionFaroe IslandsFijiFinlandFragile and conflict affected situationsFranceGabonGambia, TheGeorgiaGermanyGhanaGreeceGrenadaGuatemalaGuineaGuinea-BissauGuyanaHaitiHeavily indebted poor countries (HIPC)High incomeHondurasHong Kong SAR, ChinaHungaryIBRD onlyIcelandIDA & IBRD totalIDA blendIDA onlyIDA totalIndiaIndonesiaIran, Islamic Rep.IraqIrelandIsraelItalyJamaicaJapanJordanKazakhstanKenyaKiribatiKorea, Rep.KosovoKuwaitKyrgyz RepublicLao PDRLate-demographic dividendLatin America & Caribbean Latin America & Caribbean (excluding high income)Latin America & the Caribbean (IDA & IBRD countries)LatviaLeast developed countries: UN classificationLebanonLesothoLiberiaLibyaLithuaniaLow & middle incomeLow incomeLower middle incomeLuxembourgMacao SAR, ChinaMacedonia, FYRMadagascarMalawiMalaysiaMaldivesMaliMaltaMauritaniaMauritiusMexicoMiddle East & North AfricaMiddle East & North Africa (excluding high income)Middle East & North Africa (IDA & IBRD countries)Middle incomeMoldovaMongoliaMontenegroMoroccoMozambiqueNamibiaNepalNetherlandsNew ZealandNicaraguaNigerNigeriaNorth AmericaNorwayOECD membersOmanOther small statesPacific island small statesPakistanPanamaPapua New GuineaParaguayPeruPhilippinesPolandPortugalPost-demographic dividendPre-demographic dividendQatarRomaniaRussian FederationRwandaSaudi ArabiaSenegalSerbiaSeychellesSierra LeoneSingaporeSlovak RepublicSloveniaSmall statesSolomon IslandsSouth AfricaSouth AsiaSouth Asia (IDA & IBRD)South SudanSpainSri LankaSt. Kitts and NevisSt. LuciaSt. Vincent and the GrenadinesSub-Saharan Africa Sub-Saharan Africa (excluding high income)Sub-Saharan Africa (IDA & IBRD countries)SudanSurinameSwazilandSwedenSwitzerlandSyrian Arab RepublicTajikistanTanzaniaThailandTimor-LesteTogoTongaTrinidad and TobagoTunisiaTurkeyUgandaUkraineUnited KingdomUnited StatesUpper middle incomeUruguayVanuatuVenezuela, RBVietnamWest Bank and GazaWorldYemen, Rep.ZambiaZimbabwe Timeline:
This timeline shows a graph from 1973 to 2016 of Singapore. No data until 1972. Number of actual observations by date: 44.
Source name:
World Development Indicators
Source organization:
World Bank national accounts data, and OECD National Accounts data files.
Categories, topics:
Economy & Growth
Last updated:
apr 23, 2017
Indicators value changes by year
Maximum:
52.437
jan 1, 1998
At the date of observation
Value
Absolute change
Change from previous value
jan 1, 1973
25.21
+25.21
0.0%
jan 1, 1974
28.219
+3.01
11.94%
jan 1, 1975
26.753
-1.466
-5.2%
jan 1, 1976
29.424
+2.671
9.98%
jan 1, 1977
31.512
+2.088
7.1%
jan 1, 1978
32.333
+0.821
2.6%
jan 1, 1979
33.465
+1.132
3.5%
jan 1, 1980
35.849
+2.384
7.13%
jan 1, 1981
33.817
-2.033
-5.67%
jan 1, 1982
36.652
+2.835
8.38%
jan 1, 1983
40.155
+3.504
9.56%
jan 1, 1984
44.295
+4.139
10.31%
jan 1, 1985
45.283
+0.989
2.23%
jan 1, 1986
40.81
-4.474
-9.88%
jan 1, 1987
38.258
-2.551
-6.25%
jan 1, 1988
36.986
-1.272
-3.33%
jan 1, 1989
41.255
+4.269
11.54%
jan 1, 1990
43.723
+2.468
5.98%
jan 1, 1991
43.963
+0.24
0.55%
jan 1, 1992
45.32
+1.357
3.09%
jan 1, 1993
46.747
+1.426
3.15%
jan 1, 1994
45.005
-1.742
-3.73%
jan 1, 1995
48.188
+3.183
7.07%
jan 1, 1996
49.915
+1.728
3.59%
jan 1, 1997
49.809
-0.107
-0.21%
jan 1, 1998
52.437
+2.628
5.28%
jan 1, 1999
52.354
-0.082
-0.16%
jan 1, 2000
49.134
-3.22
-6.15%
jan 1, 2001
45.988
-3.146
-6.4%
jan 1, 2002
42.059
-3.929
-8.54%
jan 1, 2003
40.091
-1.968
-4.68%
jan 1, 2004
41.948
+1.857
4.63%
jan 1, 2005
44.442
+2.494
5.95%
jan 1, 2006
46.522
+2.081
4.68%
jan 1, 2007
49.229
+2.707
5.82%
jan 1, 2008
50.827
+1.598
3.25%
jan 1, 2009
47.138
-3.689
-7.26%
jan 1, 2010
46.809
-0.329
-0.7%
jan 1, 2011
51.976
+5.167
11.04%
jan 1, 2012
50.952
-1.024
-1.97%
jan 1, 2013
49.444
-1.508
-2.96%
jan 1, 2014
49.731
+0.287
0.58%
jan 1, 2015
48.805
-0.925
-1.86%
jan 1, 2016
48.357
-0.449
-0.92%
Ranking of countries by current statistics by years


Comments: