29
/
en
AIzaSyAYiBZKx7MnpbEhh9jyipgxe19OcubqV5w
April 1, 2024
272318
Uganda
UGA
true
2
1
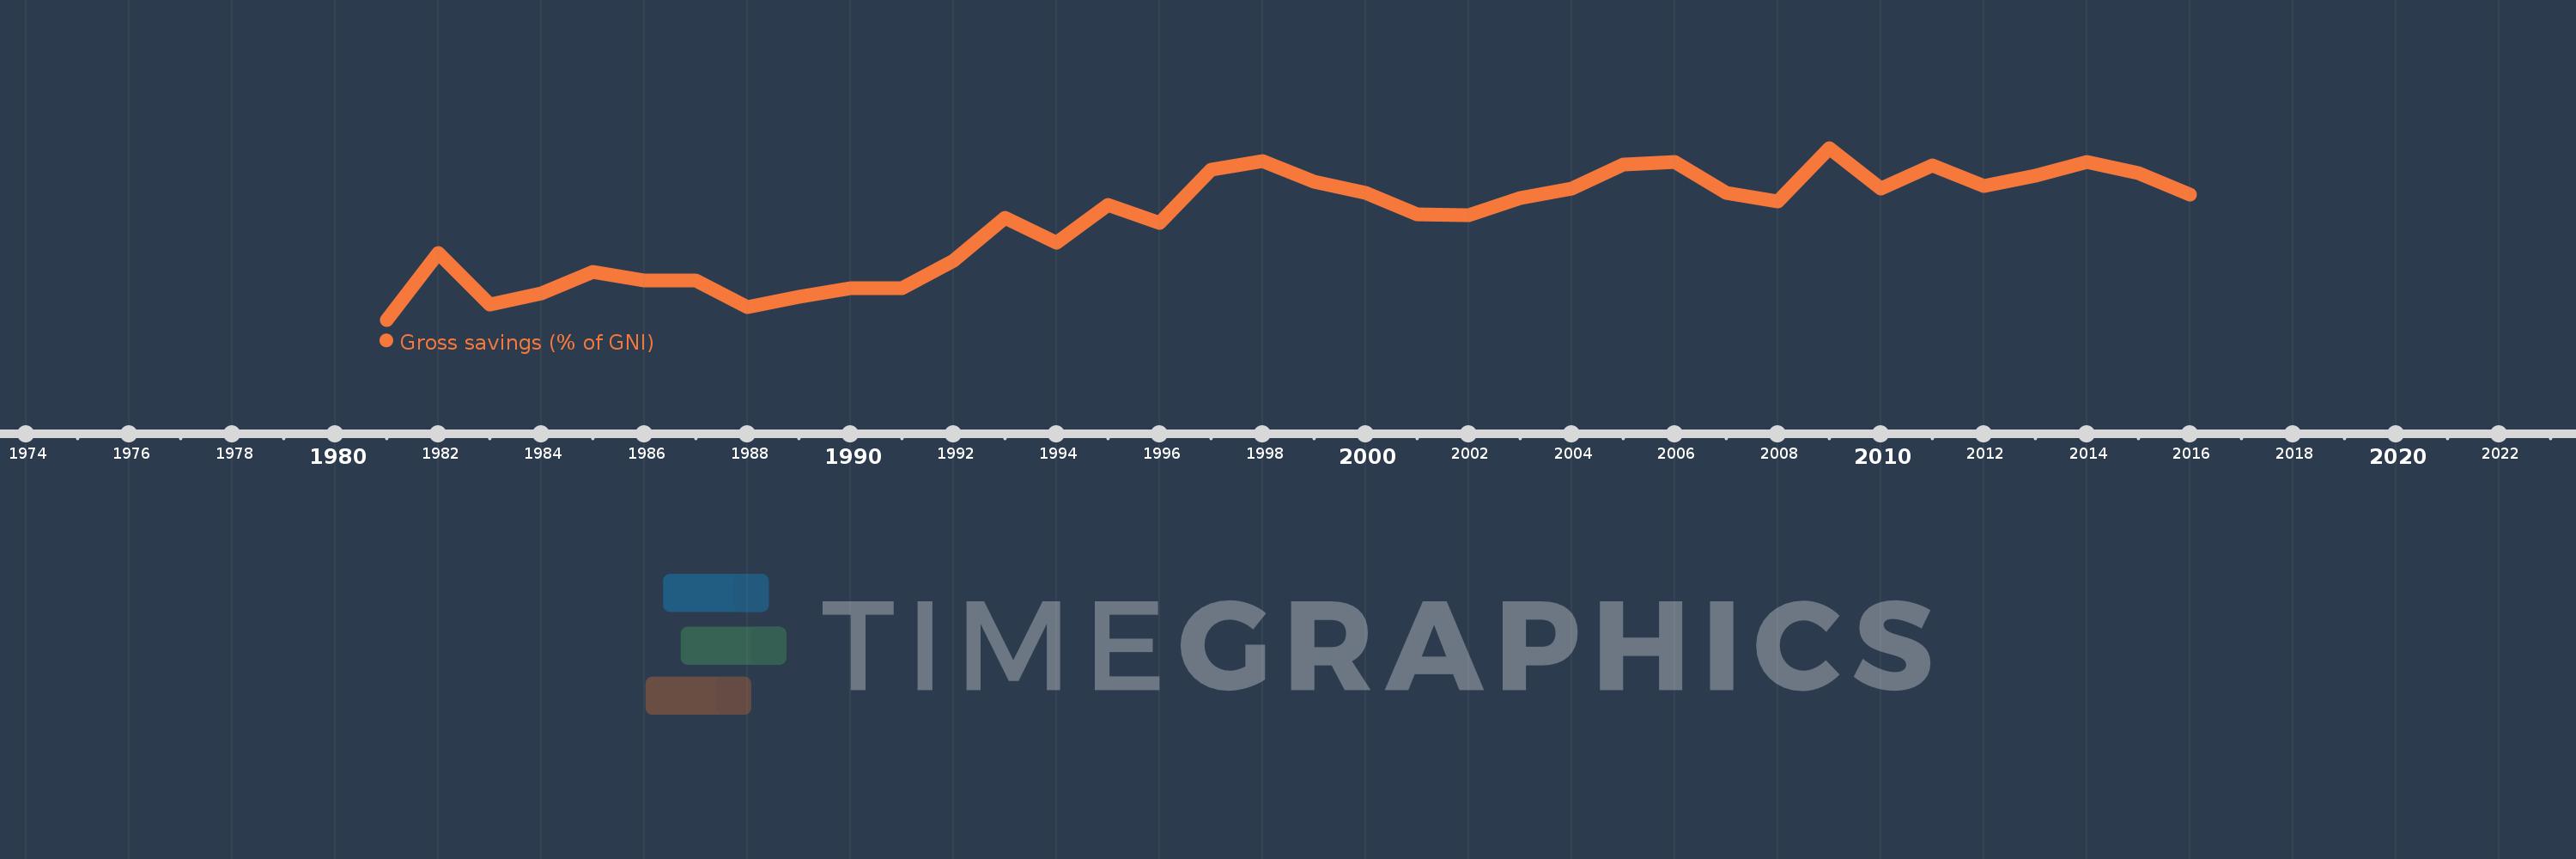
Gross savings (% of GNI)
2016,2015,2014,2013,2012,2011,2010,2009,2008,2007,2006,2005,2004,2003,2002,2001,2000,1999,1998,1997,1996,1995,1994,1993,1992,1991,1990,1989,1988,1987,1986,1985,1984,1983,1982,1981
This statistics in other country:
AfghanistanAlbaniaAlgeriaAngolaAntigua and BarbudaArab WorldArgentinaArmeniaAustraliaAustriaAzerbaijanBahamas, TheBahrainBangladeshBarbadosBelarusBelgiumBelizeBeninBermudaBhutanBoliviaBosnia and HerzegovinaBotswanaBrazilBrunei DarussalamBulgariaBurkina FasoBurundiCabo VerdeCambodiaCameroonCanadaCaribbean small statesCentral African RepublicCentral Europe and the BalticsChadChileChinaColombiaComorosCongo, Dem. Rep.Congo, Rep.Costa RicaCote d'IvoireCroatiaCyprusCzech RepublicDenmarkDjiboutiDominicaDominican RepublicEarly-demographic dividendEast Asia & PacificEast Asia & Pacific (excluding high income)East Asia & Pacific (IDA & IBRD countries)EcuadorEgypt, Arab Rep.El SalvadorEquatorial GuineaEritreaEstoniaEthiopiaEuro areaEurope & Central AsiaEurope & Central Asia (excluding high income)Europe & Central Asia (IDA & IBRD countries)European UnionFaroe IslandsFijiFinlandFragile and conflict affected situationsFranceGabonGambia, TheGeorgiaGermanyGhanaGreeceGrenadaGuatemalaGuineaGuinea-BissauGuyanaHaitiHeavily indebted poor countries (HIPC)High incomeHondurasHong Kong SAR, ChinaHungaryIBRD onlyIcelandIDA & IBRD totalIDA blendIDA onlyIDA totalIndiaIndonesiaIran, Islamic Rep.IraqIrelandIsraelItalyJamaicaJapanJordanKazakhstanKenyaKiribatiKorea, Rep.KosovoKuwaitKyrgyz RepublicLao PDRLate-demographic dividendLatin America & Caribbean Latin America & Caribbean (excluding high income)Latin America & the Caribbean (IDA & IBRD countries)LatviaLeast developed countries: UN classificationLebanonLesothoLiberiaLibyaLithuaniaLow & middle incomeLow incomeLower middle incomeLuxembourgMacao SAR, ChinaMacedonia, FYRMadagascarMalawiMalaysiaMaldivesMaliMaltaMauritaniaMauritiusMexicoMiddle East & North AfricaMiddle East & North Africa (excluding high income)Middle East & North Africa (IDA & IBRD countries)Middle incomeMoldovaMongoliaMontenegroMoroccoMozambiqueNamibiaNepalNetherlandsNew ZealandNicaraguaNigerNigeriaNorth AmericaNorwayOECD membersOmanOther small statesPacific island small statesPakistanPanamaPapua New GuineaParaguayPeruPhilippinesPolandPortugalPost-demographic dividendPre-demographic dividendQatarRomaniaRussian FederationRwandaSaudi ArabiaSenegalSerbiaSeychellesSierra LeoneSingaporeSlovak RepublicSloveniaSmall statesSolomon IslandsSouth AfricaSouth AsiaSouth Asia (IDA & IBRD)South SudanSpainSri LankaSt. Kitts and NevisSt. LuciaSt. Vincent and the GrenadinesSub-Saharan Africa Sub-Saharan Africa (excluding high income)Sub-Saharan Africa (IDA & IBRD countries)SudanSurinameSwazilandSwedenSwitzerlandSyrian Arab RepublicTajikistanTanzaniaThailandTimor-LesteTogoTongaTrinidad and TobagoTunisiaTurkeyUgandaUkraineUnited KingdomUnited StatesUpper middle incomeUruguayVanuatuVenezuela, RBVietnamWest Bank and GazaWorldYemen, Rep.ZambiaZimbabwe Timeline:
This timeline shows a graph from 1981 to 2016 of Uganda. No data until 1980. Number of actual observations by date: 36.
Source name:
World Development Indicators
Source organization:
World Bank national accounts data, and OECD National Accounts data files.
Categories, topics:
Economy & Growth
Last updated:
apr 23, 2017
Indicators value changes by year
Maximum:
22.586
jan 1, 2009
At the date of observation
Value
Absolute change
Change from previous value
jan 1, 1981
1.908
+1.908
0.0%
jan 1, 1982
9.963
+8.055
422.3%
jan 1, 1983
3.719
-6.244
-62.67%
jan 1, 1984
5.109
+1.391
37.39%
jan 1, 1985
7.669
+2.559
50.09%
jan 1, 1986
6.665
-1.004
-13.09%
jan 1, 1987
6.641
-0.024
-0.35%
jan 1, 1988
3.444
-3.197
-48.14%
jan 1, 1989
4.706
+1.262
36.65%
jan 1, 1990
5.724
+1.017
21.61%
jan 1, 1991
5.696
-0.028
-0.48%
jan 1, 1992
9.008
+3.312
58.15%
jan 1, 1993
14.192
+5.184
57.55%
jan 1, 1994
11.134
-3.058
-21.55%
jan 1, 1995
15.724
+4.59
41.22%
jan 1, 1996
13.609
-2.115
-13.45%
jan 1, 1997
19.939
+6.33
46.52%
jan 1, 1998
20.957
+1.018
5.11%
jan 1, 1999
18.537
-2.42
-11.55%
jan 1, 2000
17.22
-1.317
-7.11%
jan 1, 2001
14.61
-2.609
-15.15%
jan 1, 2002
14.51
-0.1
-0.69%
jan 1, 2003
16.556
+2.046
14.1%
jan 1, 2004
17.705
+1.149
6.94%
jan 1, 2005
20.548
+2.843
16.06%
jan 1, 2006
20.89
+0.343
1.67%
jan 1, 2007
17.203
-3.687
-17.65%
jan 1, 2008
16.158
-1.045
-6.08%
jan 1, 2009
22.586
+6.428
39.78%
jan 1, 2010
17.726
-4.859
-21.52%
jan 1, 2011
20.526
+2.8
15.8%
jan 1, 2012
18.004
-2.522
-12.29%
jan 1, 2013
19.207
+1.202
6.68%
jan 1, 2014
20.933
+1.727
8.99%
jan 1, 2015
19.598
-1.336
-6.38%
jan 1, 2016
16.97
-2.628
-13.41%
Ranking of countries by current statistics by years


Comments: