29
/
en
AIzaSyAYiBZKx7MnpbEhh9jyipgxe19OcubqV5w
April 1, 2024
50959
Middle income
MIC
false
2
1
Gross savings (% of GNI)
2016,2015,2014,2013,2012,2011,2010,2009,2008,2007,2006,2005,2004,2003,2002,2001,2000,1999,1998,1997,1996,1995,1994,1993,1992,1991,1990,1989,1988,1987,1986,1985,1984,1983,1982,1981,1980
This statistics in other country:
AfghanistanAlbaniaAlgeriaAngolaAntigua and BarbudaArab WorldArgentinaArmeniaAustraliaAustriaAzerbaijanBahamas, TheBahrainBangladeshBarbadosBelarusBelgiumBelizeBeninBermudaBhutanBoliviaBosnia and HerzegovinaBotswanaBrazilBrunei DarussalamBulgariaBurkina FasoBurundiCabo VerdeCambodiaCameroonCanadaCaribbean small statesCentral African RepublicCentral Europe and the BalticsChadChileChinaColombiaComorosCongo, Dem. Rep.Congo, Rep.Costa RicaCote d'IvoireCroatiaCyprusCzech RepublicDenmarkDjiboutiDominicaDominican RepublicEarly-demographic dividendEast Asia & PacificEast Asia & Pacific (excluding high income)East Asia & Pacific (IDA & IBRD countries)EcuadorEgypt, Arab Rep.El SalvadorEquatorial GuineaEritreaEstoniaEthiopiaEuro areaEurope & Central AsiaEurope & Central Asia (excluding high income)Europe & Central Asia (IDA & IBRD countries)European UnionFaroe IslandsFijiFinlandFragile and conflict affected situationsFranceGabonGambia, TheGeorgiaGermanyGhanaGreeceGrenadaGuatemalaGuineaGuinea-BissauGuyanaHaitiHeavily indebted poor countries (HIPC)High incomeHondurasHong Kong SAR, ChinaHungaryIBRD onlyIcelandIDA & IBRD totalIDA blendIDA onlyIDA totalIndiaIndonesiaIran, Islamic Rep.IraqIrelandIsraelItalyJamaicaJapanJordanKazakhstanKenyaKiribatiKorea, Rep.KosovoKuwaitKyrgyz RepublicLao PDRLate-demographic dividendLatin America & Caribbean Latin America & Caribbean (excluding high income)Latin America & the Caribbean (IDA & IBRD countries)LatviaLeast developed countries: UN classificationLebanonLesothoLiberiaLibyaLithuaniaLow & middle incomeLow incomeLower middle incomeLuxembourgMacao SAR, ChinaMacedonia, FYRMadagascarMalawiMalaysiaMaldivesMaliMaltaMauritaniaMauritiusMexicoMiddle East & North AfricaMiddle East & North Africa (excluding high income)Middle East & North Africa (IDA & IBRD countries)Middle incomeMoldovaMongoliaMontenegroMoroccoMozambiqueNamibiaNepalNetherlandsNew ZealandNicaraguaNigerNigeriaNorth AmericaNorwayOECD membersOmanOther small statesPacific island small statesPakistanPanamaPapua New GuineaParaguayPeruPhilippinesPolandPortugalPost-demographic dividendPre-demographic dividendQatarRomaniaRussian FederationRwandaSaudi ArabiaSenegalSerbiaSeychellesSierra LeoneSingaporeSlovak RepublicSloveniaSmall statesSolomon IslandsSouth AfricaSouth AsiaSouth Asia (IDA & IBRD)South SudanSpainSri LankaSt. Kitts and NevisSt. LuciaSt. Vincent and the GrenadinesSub-Saharan Africa Sub-Saharan Africa (excluding high income)Sub-Saharan Africa (IDA & IBRD countries)SudanSurinameSwazilandSwedenSwitzerlandSyrian Arab RepublicTajikistanTanzaniaThailandTimor-LesteTogoTongaTrinidad and TobagoTunisiaTurkeyUgandaUkraineUnited KingdomUnited StatesUpper middle incomeUruguayVanuatuVenezuela, RBVietnamWest Bank and GazaWorldYemen, Rep.ZambiaZimbabwe Timeline:
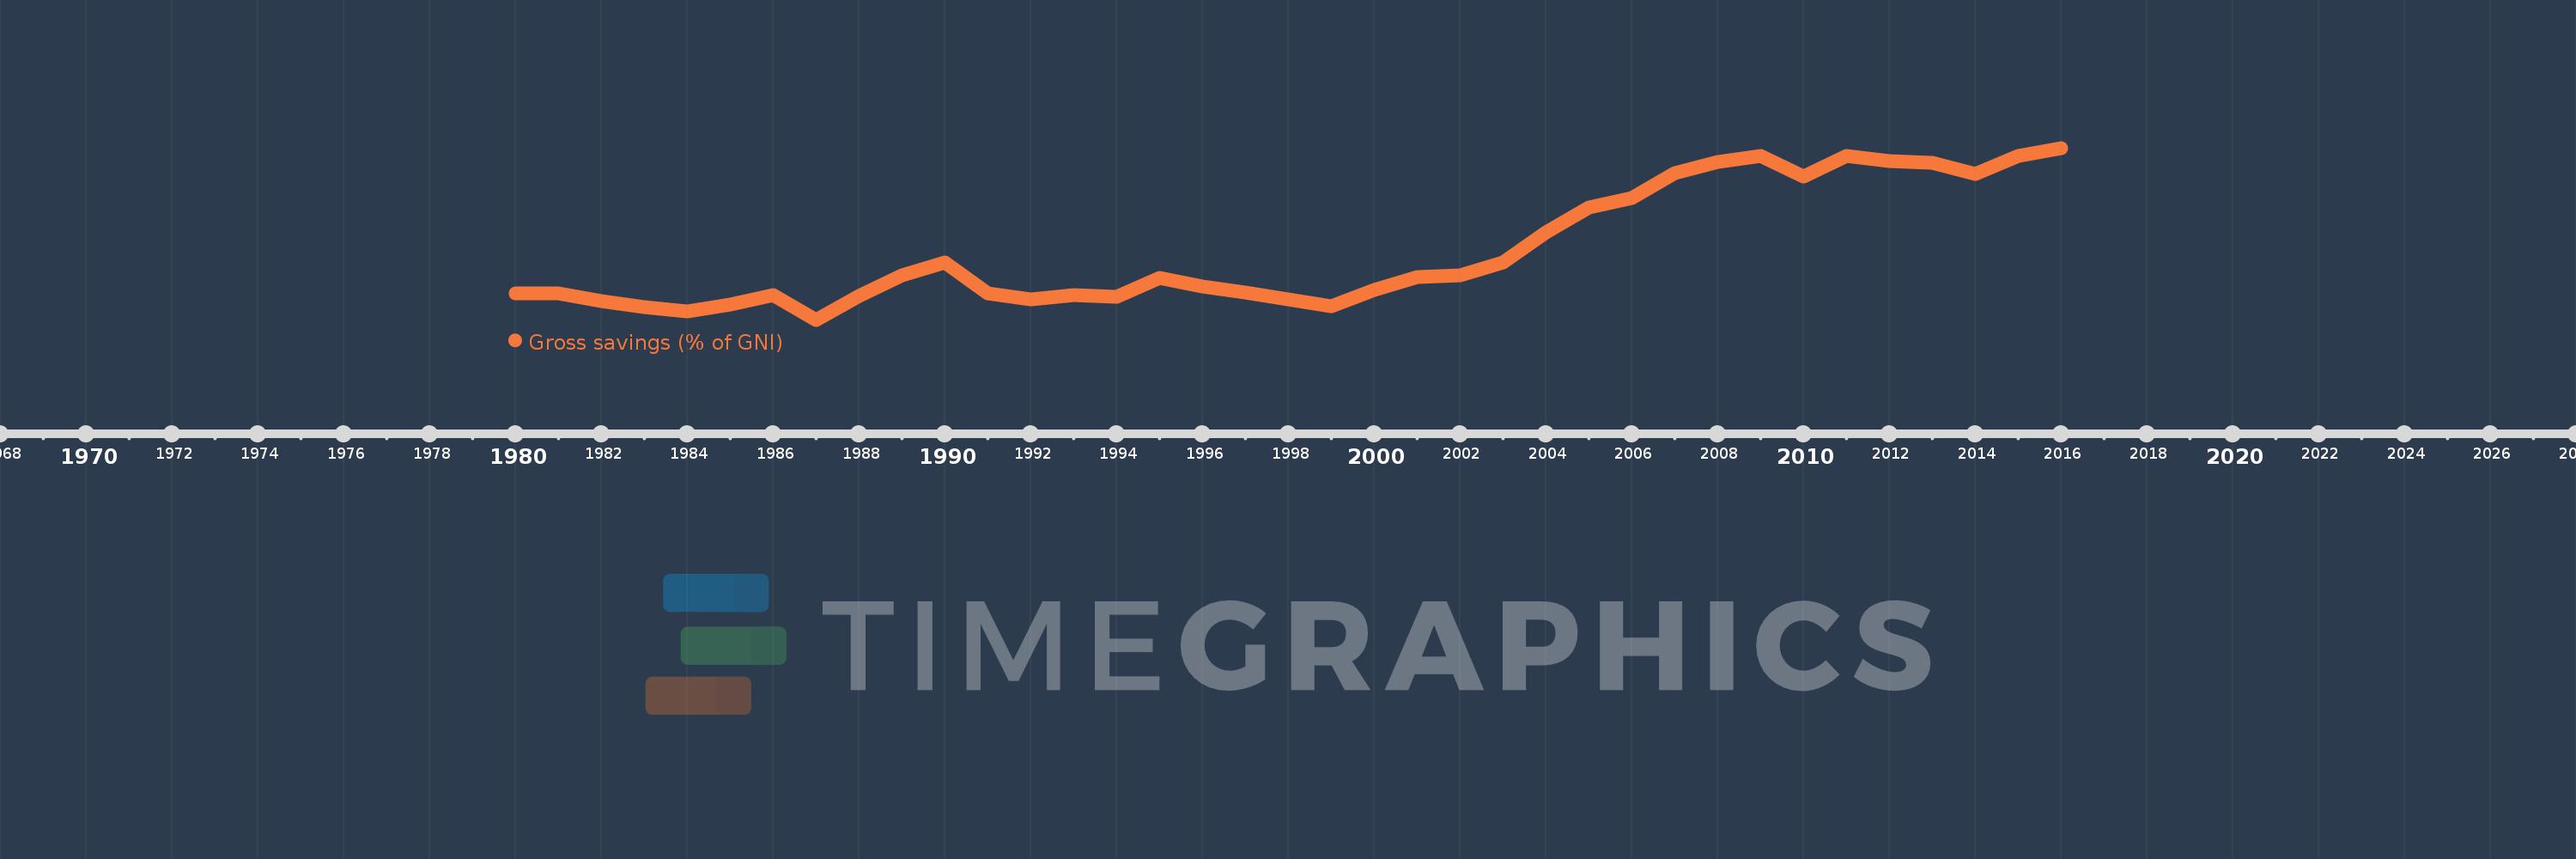
This timeline shows a graph from 1980 to 2016 of Middle income. No data until 1979. Number of actual observations by date: 37.
Source name:
World Development Indicators
Source organization:
World Bank national accounts data, and OECD National Accounts data files.
Categories, topics:
Economy & Growth
Last updated:
apr 23, 2017
Indicators value changes by year
Minimum:
22.521
jan 1, 1987
Maximum:
34.836
jan 1, 2016
At the date of observation
Value
Absolute change
Change from previous value
jan 1, 1980
24.386
+24.386
0.0%
jan 1, 1981
24.403
+0.017
0.07%
jan 1, 1982
23.875
-0.528
-2.16%
jan 1, 1983
23.414
-0.462
-1.93%
jan 1, 1984
23.129
-0.285
-1.22%
jan 1, 1985
23.625
+0.496
2.14%
jan 1, 1986
24.275
+0.65
2.75%
jan 1, 1987
22.521
-1.754
-7.23%
jan 1, 1988
24.218
+1.697
7.54%
jan 1, 1989
25.715
+1.497
6.18%
jan 1, 1990
26.641
+0.926
3.6%
jan 1, 1991
24.434
-2.207
-8.28%
jan 1, 1992
23.96
-0.474
-1.94%
jan 1, 1993
24.27
+0.31
1.29%
jan 1, 1994
24.159
-0.112
-0.46%
jan 1, 1995
25.527
+1.369
5.67%
jan 1, 1996
24.923
-0.604
-2.37%
jan 1, 1997
24.494
-0.43
-1.72%
jan 1, 1998
23.998
-0.495
-2.02%
jan 1, 1999
23.505
-0.494
-2.06%
jan 1, 2000
24.659
+1.154
4.91%
jan 1, 2001
25.56
+0.902
3.66%
jan 1, 2002
25.689
+0.129
0.5%
jan 1, 2003
26.634
+0.945
3.68%
jan 1, 2004
28.796
+2.162
8.12%
jan 1, 2005
30.562
+1.766
6.13%
jan 1, 2006
31.276
+0.714
2.34%
jan 1, 2007
33.004
+1.728
5.53%
jan 1, 2008
33.808
+0.804
2.44%
jan 1, 2009
34.244
+0.436
1.29%
jan 1, 2010
32.812
-1.432
-4.18%
jan 1, 2011
34.258
+1.447
4.41%
jan 1, 2012
33.898
-0.36
-1.05%
jan 1, 2013
33.75
-0.148
-0.44%
jan 1, 2014
32.975
-0.775
-2.3%
jan 1, 2015
34.283
+1.309
3.97%
jan 1, 2016
34.836
+0.553
1.61%
Ranking of countries by current statistics by years


Comments: