29
/
en
AIzaSyAYiBZKx7MnpbEhh9jyipgxe19OcubqV5w
April 1, 2024
52524
OECD members
OED
false
2
1
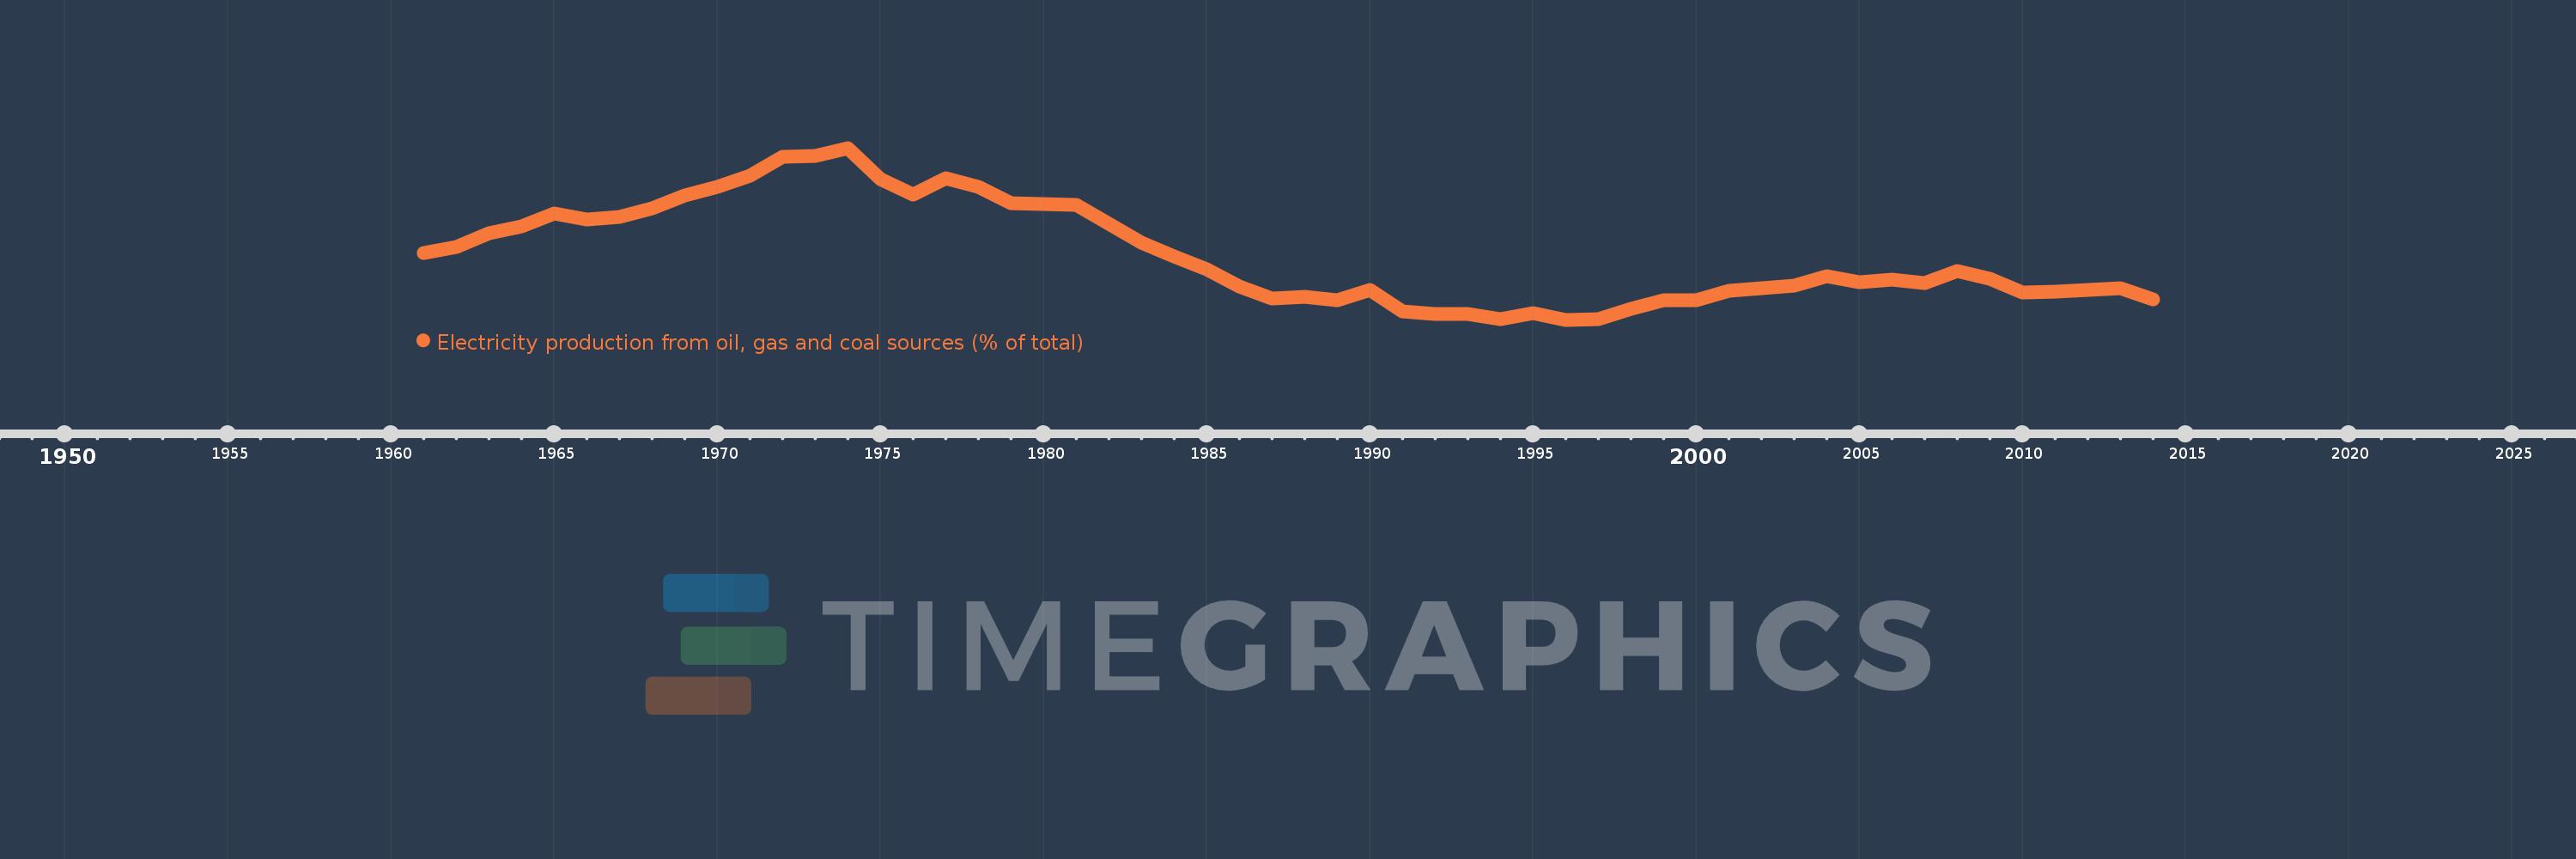
Electricity production from oil, gas and coal sources (% of total)
2014,2013,2012,2011,2010,2009,2008,2007,2006,2005,2004,2003,2002,2001,2000,1999,1998,1997,1996,1995,1994,1993,1992,1991,1990,1989,1988,1987,1986,1985,1984,1983,1982,1981,1980,1979,1978,1977,1976,1975,1974,1973,1972,1971,1970,1969,1968,1967,1966,1965,1964,1963,1962,1961
This statistics in other country:
AlbaniaAlgeriaAngolaArab WorldArgentinaArmeniaAustraliaAustriaAzerbaijanBahrainBangladeshBelarusBelgiumBeninBoliviaBosnia and HerzegovinaBotswanaBrazilBrunei DarussalamBulgariaCambodiaCameroonCanadaCentral Europe and the BalticsChileChinaColombiaCongo, Dem. Rep.Congo, Rep.Costa RicaCote d'IvoireCroatiaCubaCuracaoCyprusCzech RepublicDenmarkDominican RepublicEarly-demographic dividendEast Asia & PacificEast Asia & Pacific (excluding high income)East Asia & Pacific (IDA & IBRD countries)EcuadorEgypt, Arab Rep.El SalvadorEritreaEstoniaEthiopiaEuro areaEurope & Central AsiaEurope & Central Asia (excluding high income)Europe & Central Asia (IDA & IBRD countries)European UnionFinlandFragile and conflict affected situationsFranceGabonGeorgiaGermanyGhanaGibraltarGreeceGuatemalaHaitiHeavily indebted poor countries (HIPC)High incomeHondurasHong Kong SAR, ChinaHungaryIBRD onlyIcelandIDA & IBRD totalIDA blendIDA onlyIDA totalIndiaIndonesiaIran, Islamic Rep.IraqIrelandIsraelItalyJamaicaJapanJordanKazakhstanKenyaKorea, Dem. People’s Rep.Korea, Rep.KosovoKuwaitKyrgyz RepublicLate-demographic dividendLatin America & Caribbean Latin America & Caribbean (excluding high income)Latin America & the Caribbean (IDA & IBRD countries)LatviaLeast developed countries: UN classificationLebanonLibyaLithuaniaLow & middle incomeLower middle incomeLuxembourgMacedonia, FYRMalaysiaMaltaMauritiusMexicoMiddle East & North AfricaMiddle East & North Africa (excluding high income)Middle East & North Africa (IDA & IBRD countries)Middle incomeMoldovaMongoliaMontenegroMoroccoMozambiqueMyanmarNamibiaNepalNetherlandsNew ZealandNicaraguaNigerNigeriaNorth AmericaNorwayOECD membersOmanOther small statesPakistanPanamaParaguayPeruPhilippinesPolandPortugalPost-demographic dividendPre-demographic dividendQatarRomaniaRussian FederationSaudi ArabiaSenegalSerbiaSingaporeSlovak RepublicSloveniaSmall statesSouth AfricaSouth AsiaSouth Asia (IDA & IBRD)South SudanSpainSri LankaSub-Saharan Africa Sub-Saharan Africa (excluding high income)Sub-Saharan Africa (IDA & IBRD countries)SudanSwedenSwitzerlandSyrian Arab RepublicTajikistanTanzaniaThailandTogoTrinidad and TobagoTunisiaTurkeyTurkmenistanUkraineUnited Arab EmiratesUnited KingdomUnited StatesUpper middle incomeUruguayUzbekistanVenezuela, RBVietnamWorldYemen, Rep.ZambiaZimbabwe Timeline:
This timeline shows a graph from 1961 to 2014 of OECD members. No data until 1960. Number of actual observations by date: 54.
Source name:
World Development Indicators
Source organization:
IEA Statistics © OECD/IEA 2014 (http://www.iea.org/stats/index.asp), subject to https://www.iea.org/t&c/termsandconditions/
Categories, topics:
Energy & Mining, Environment
Last updated:
apr 23, 2017
Indicators value changes by year
Minimum:
57.506
jan 1, 1996
Maximum:
74.496
jan 1, 1974
At the date of observation
Value
Absolute change
Change from previous value
jan 1, 1961
64.13
+64.13
0.0%
jan 1, 1962
64.714
+0.584
0.91%
jan 1, 1963
66.037
+1.322
2.04%
jan 1, 1964
66.74
+0.703
1.06%
jan 1, 1965
68.051
+1.311
1.97%
jan 1, 1966
67.425
-0.626
-0.92%
jan 1, 1967
67.716
+0.291
0.43%
jan 1, 1968
68.497
+0.781
1.15%
jan 1, 1969
69.813
+1.316
1.92%
jan 1, 1970
70.642
+0.828
1.19%
jan 1, 1971
71.752
+1.111
1.57%
jan 1, 1972
73.651
+1.899
2.65%
jan 1, 1973
73.702
+0.051
0.07%
jan 1, 1974
74.496
+0.795
1.08%
jan 1, 1975
71.416
-3.081
-4.14%
jan 1, 1976
69.852
-1.564
-2.19%
jan 1, 1977
71.475
+1.623
2.32%
jan 1, 1978
70.619
-0.856
-1.2%
jan 1, 1979
69.048
-1.571
-2.22%
jan 1, 1980
68.928
-0.12
-0.17%
jan 1, 1981
68.893
-0.036
-0.05%
jan 1, 1982
66.988
-1.905
-2.77%
jan 1, 1983
65.153
-1.835
-2.74%
jan 1, 1984
63.778
-1.375
-2.11%
jan 1, 1985
62.533
-1.245
-1.95%
jan 1, 1986
60.776
-1.757
-2.81%
jan 1, 1987
59.621
-1.155
-1.9%
jan 1, 1988
59.812
+0.191
0.32%
jan 1, 1989
59.395
-0.417
-0.7%
jan 1, 1990
60.42
+1.025
1.73%
jan 1, 1991
58.329
-2.091
-3.46%
jan 1, 1992
58.113
-0.215
-0.37%
jan 1, 1993
58.1
-0.014
-0.02%
jan 1, 1994
57.574
-0.525
-0.9%
jan 1, 1995
58.121
+0.546
0.95%
jan 1, 1996
57.506
-0.615
-1.06%
jan 1, 1997
57.587
+0.081
0.14%
jan 1, 1998
58.579
+0.992
1.72%
jan 1, 1999
59.443
+0.864
1.48%
jan 1, 2000
59.46
+0.017
0.03%
jan 1, 2001
60.333
+0.874
1.47%
jan 1, 2002
60.606
+0.273
0.45%
jan 1, 2003
60.871
+0.265
0.44%
jan 1, 2004
61.855
+0.984
1.62%
jan 1, 2005
61.244
-0.611
-0.99%
jan 1, 2006
61.433
+0.189
0.31%
jan 1, 2007
61.173
-0.261
-0.42%
jan 1, 2008
62.353
+1.181
1.93%
jan 1, 2009
61.569
-0.784
-1.26%
jan 1, 2010
60.222
-1.347
-2.19%
jan 1, 2011
60.31
+0.088
0.15%
jan 1, 2012
60.434
+0.124
0.21%
jan 1, 2013
60.643
+0.209
0.35%
jan 1, 2014
59.485
-1.158
-1.91%
Ranking of countries by current statistics by years


Comments: