29
/
en
AIzaSyAYiBZKx7MnpbEhh9jyipgxe19OcubqV5w
April 1, 2024
104760
Chile
CHL
true
2
1
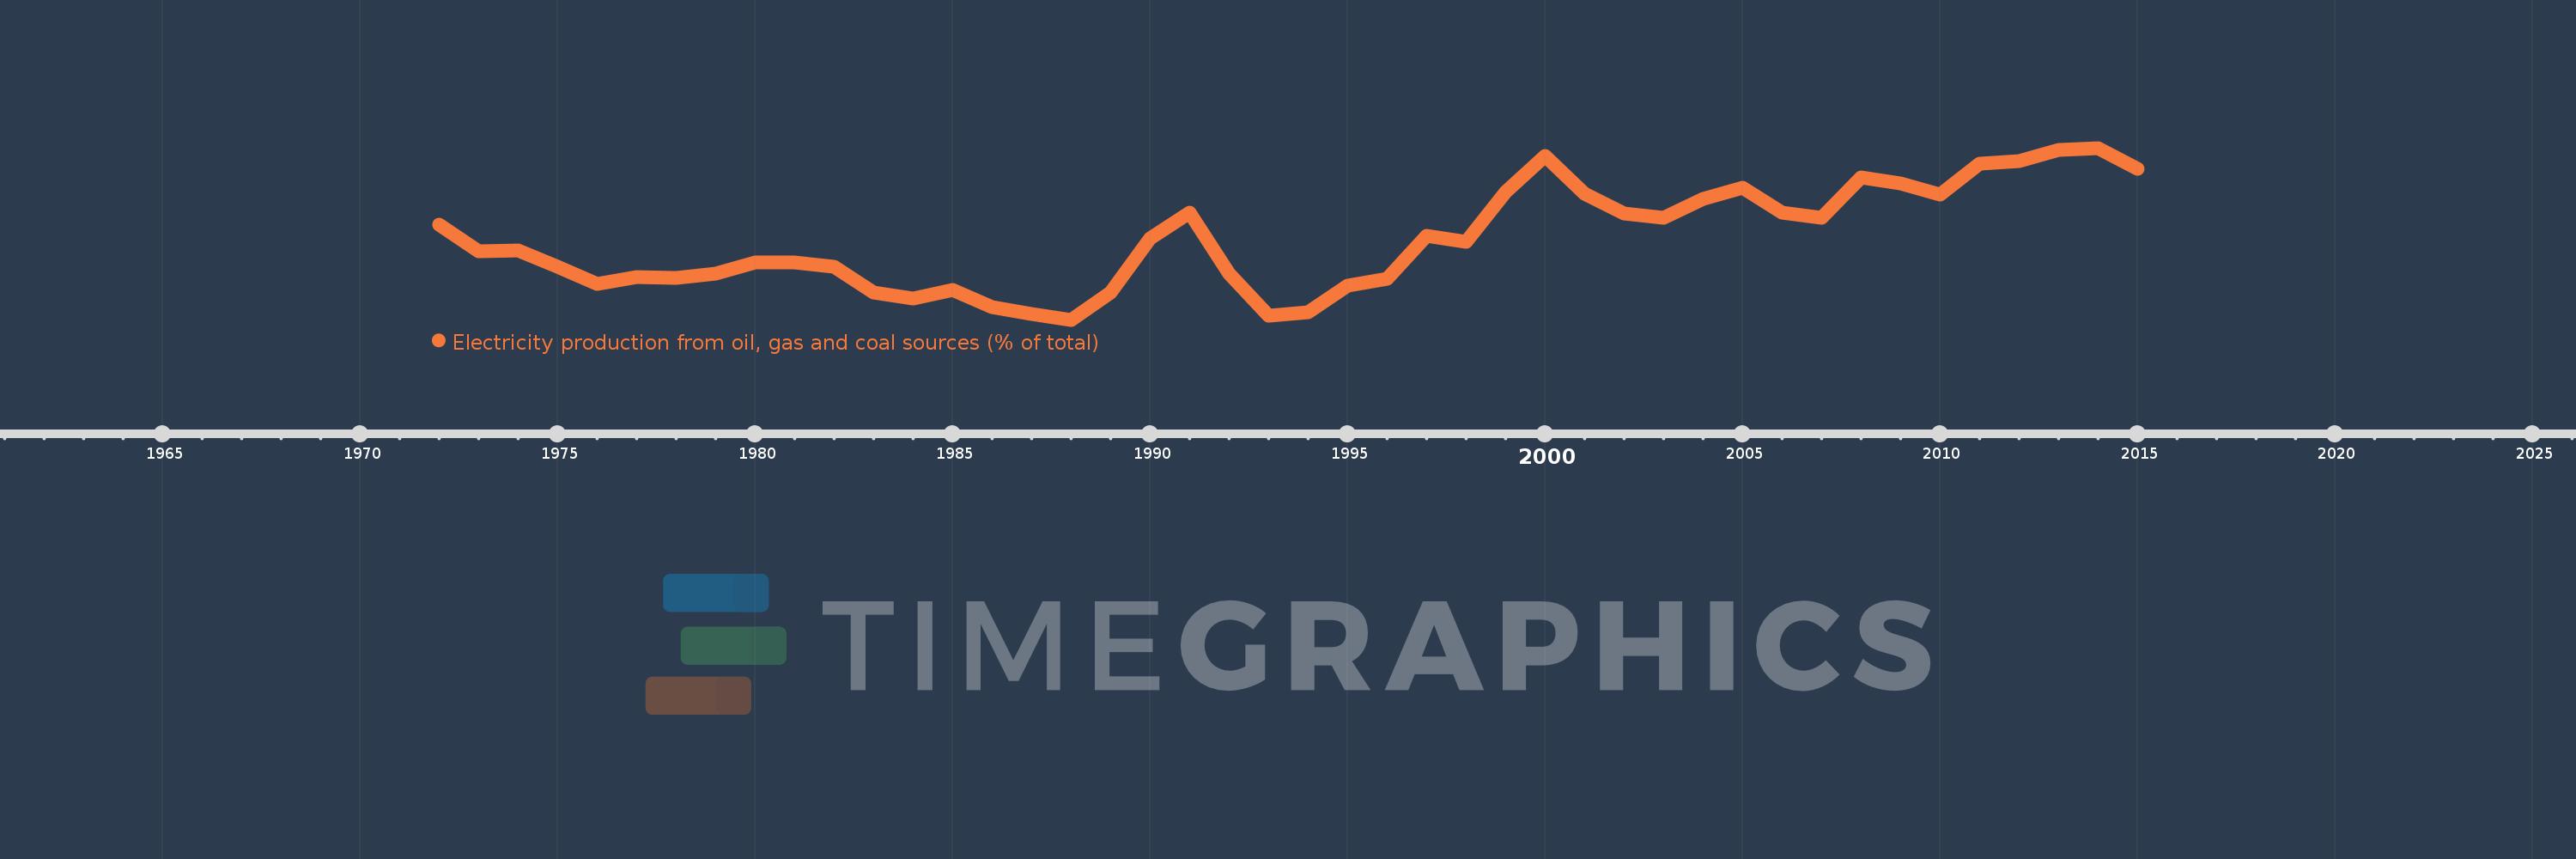
Electricity production from oil, gas and coal sources (% of total)
2015,2014,2013,2012,2011,2010,2009,2008,2007,2006,2005,2004,2003,2002,2001,2000,1999,1998,1997,1996,1995,1994,1993,1992,1991,1990,1989,1988,1987,1986,1985,1984,1983,1982,1981,1980,1979,1978,1977,1976,1975,1974,1973,1972
This statistics in other country:
AlbaniaAlgeriaAngolaArab WorldArgentinaArmeniaAustraliaAustriaAzerbaijanBahrainBangladeshBelarusBelgiumBeninBoliviaBosnia and HerzegovinaBotswanaBrazilBrunei DarussalamBulgariaCambodiaCameroonCanadaCentral Europe and the BalticsChileChinaColombiaCongo, Dem. Rep.Congo, Rep.Costa RicaCote d'IvoireCroatiaCubaCuracaoCyprusCzech RepublicDenmarkDominican RepublicEarly-demographic dividendEast Asia & PacificEast Asia & Pacific (excluding high income)East Asia & Pacific (IDA & IBRD countries)EcuadorEgypt, Arab Rep.El SalvadorEritreaEstoniaEthiopiaEuro areaEurope & Central AsiaEurope & Central Asia (excluding high income)Europe & Central Asia (IDA & IBRD countries)European UnionFinlandFragile and conflict affected situationsFranceGabonGeorgiaGermanyGhanaGibraltarGreeceGuatemalaHaitiHeavily indebted poor countries (HIPC)High incomeHondurasHong Kong SAR, ChinaHungaryIBRD onlyIcelandIDA & IBRD totalIDA blendIDA onlyIDA totalIndiaIndonesiaIran, Islamic Rep.IraqIrelandIsraelItalyJamaicaJapanJordanKazakhstanKenyaKorea, Dem. People’s Rep.Korea, Rep.KosovoKuwaitKyrgyz RepublicLate-demographic dividendLatin America & Caribbean Latin America & Caribbean (excluding high income)Latin America & the Caribbean (IDA & IBRD countries)LatviaLeast developed countries: UN classificationLebanonLibyaLithuaniaLow & middle incomeLower middle incomeLuxembourgMacedonia, FYRMalaysiaMaltaMauritiusMexicoMiddle East & North AfricaMiddle East & North Africa (excluding high income)Middle East & North Africa (IDA & IBRD countries)Middle incomeMoldovaMongoliaMontenegroMoroccoMozambiqueMyanmarNamibiaNepalNetherlandsNew ZealandNicaraguaNigerNigeriaNorth AmericaNorwayOECD membersOmanOther small statesPakistanPanamaParaguayPeruPhilippinesPolandPortugalPost-demographic dividendPre-demographic dividendQatarRomaniaRussian FederationSaudi ArabiaSenegalSerbiaSingaporeSlovak RepublicSloveniaSmall statesSouth AfricaSouth AsiaSouth Asia (IDA & IBRD)South SudanSpainSri LankaSub-Saharan Africa Sub-Saharan Africa (excluding high income)Sub-Saharan Africa (IDA & IBRD countries)SudanSwedenSwitzerlandSyrian Arab RepublicTajikistanTanzaniaThailandTogoTrinidad and TobagoTunisiaTurkeyTurkmenistanUkraineUnited Arab EmiratesUnited KingdomUnited StatesUpper middle incomeUruguayUzbekistanVenezuela, RBVietnamWorldYemen, Rep.ZambiaZimbabwe Timeline:
This timeline shows a graph from 1972 to 2015 of Chile. No data until 1971. Number of actual observations by date: 44.
Source name:
World Development Indicators
Source organization:
IEA Statistics © OECD/IEA 2014 (http://www.iea.org/stats/index.asp), subject to https://www.iea.org/t&c/termsandconditions/
Categories, topics:
Energy & Mining, Environment
Last updated:
apr 23, 2017
Indicators value changes by year
Minimum:
16.263
jan 1, 1988
Maximum:
64.109
jan 1, 2014
At the date of observation
Value
Absolute change
Change from previous value
jan 1, 1972
42.809
+42.809
0.0%
jan 1, 1973
35.225
-7.584
-17.72%
jan 1, 1974
35.592
+0.367
1.04%
jan 1, 1975
31.053
-4.539
-12.75%
jan 1, 1976
26.26
-4.793
-15.44%
jan 1, 1977
28.08
+1.82
6.93%
jan 1, 1978
27.895
-0.185
-0.66%
jan 1, 1979
29.131
+1.236
4.43%
jan 1, 1980
32.262
+3.13
10.75%
jan 1, 1981
32.125
-0.137
-0.42%
jan 1, 1982
31.04
-1.085
-3.38%
jan 1, 1983
23.755
-7.285
-23.47%
jan 1, 1984
22.204
-1.552
-6.53%
jan 1, 1985
24.605
+2.402
10.82%
jan 1, 1986
19.765
-4.841
-19.67%
jan 1, 1987
17.865
-1.9
-9.61%
jan 1, 1988
16.263
-1.602
-8.97%
jan 1, 1989
23.825
+7.562
46.5%
jan 1, 1990
39.004
+15.179
63.71%
jan 1, 1991
46.163
+7.159
18.35%
jan 1, 1992
29.027
-17.136
-37.12%
jan 1, 1993
17.305
-11.721
-40.38%
jan 1, 1994
18.335
+1.03
5.95%
jan 1, 1995
25.735
+7.4
40.36%
jan 1, 1996
27.595
+1.86
7.23%
jan 1, 1997
39.547
+11.952
43.31%
jan 1, 1998
37.865
-1.682
-4.25%
jan 1, 1999
51.829
+13.964
36.88%
jan 1, 2000
61.969
+10.14
19.56%
jan 1, 2001
51.452
-10.517
-16.97%
jan 1, 2002
45.738
-5.714
-11.11%
jan 1, 2003
44.549
-1.189
-2.6%
jan 1, 2004
49.843
+5.294
11.88%
jan 1, 2005
53.099
+3.256
6.53%
jan 1, 2006
46.117
-6.982
-13.15%
jan 1, 2007
44.745
-1.372
-2.97%
jan 1, 2008
55.844
+11.099
24.81%
jan 1, 2009
54.251
-1.593
-2.85%
jan 1, 2010
51.013
-3.238
-5.97%
jan 1, 2011
59.612
+8.599
16.86%
jan 1, 2012
60.404
+0.791
1.33%
jan 1, 2013
63.555
+3.151
5.22%
jan 1, 2014
64.109
+0.554
0.87%
jan 1, 2015
58.347
-5.762
-8.99%
Ranking of countries by current statistics by years


Comments: