29
/
en
AIzaSyAYiBZKx7MnpbEhh9jyipgxe19OcubqV5w
April 1, 2024
228359
Romania
ROU
true
2
1
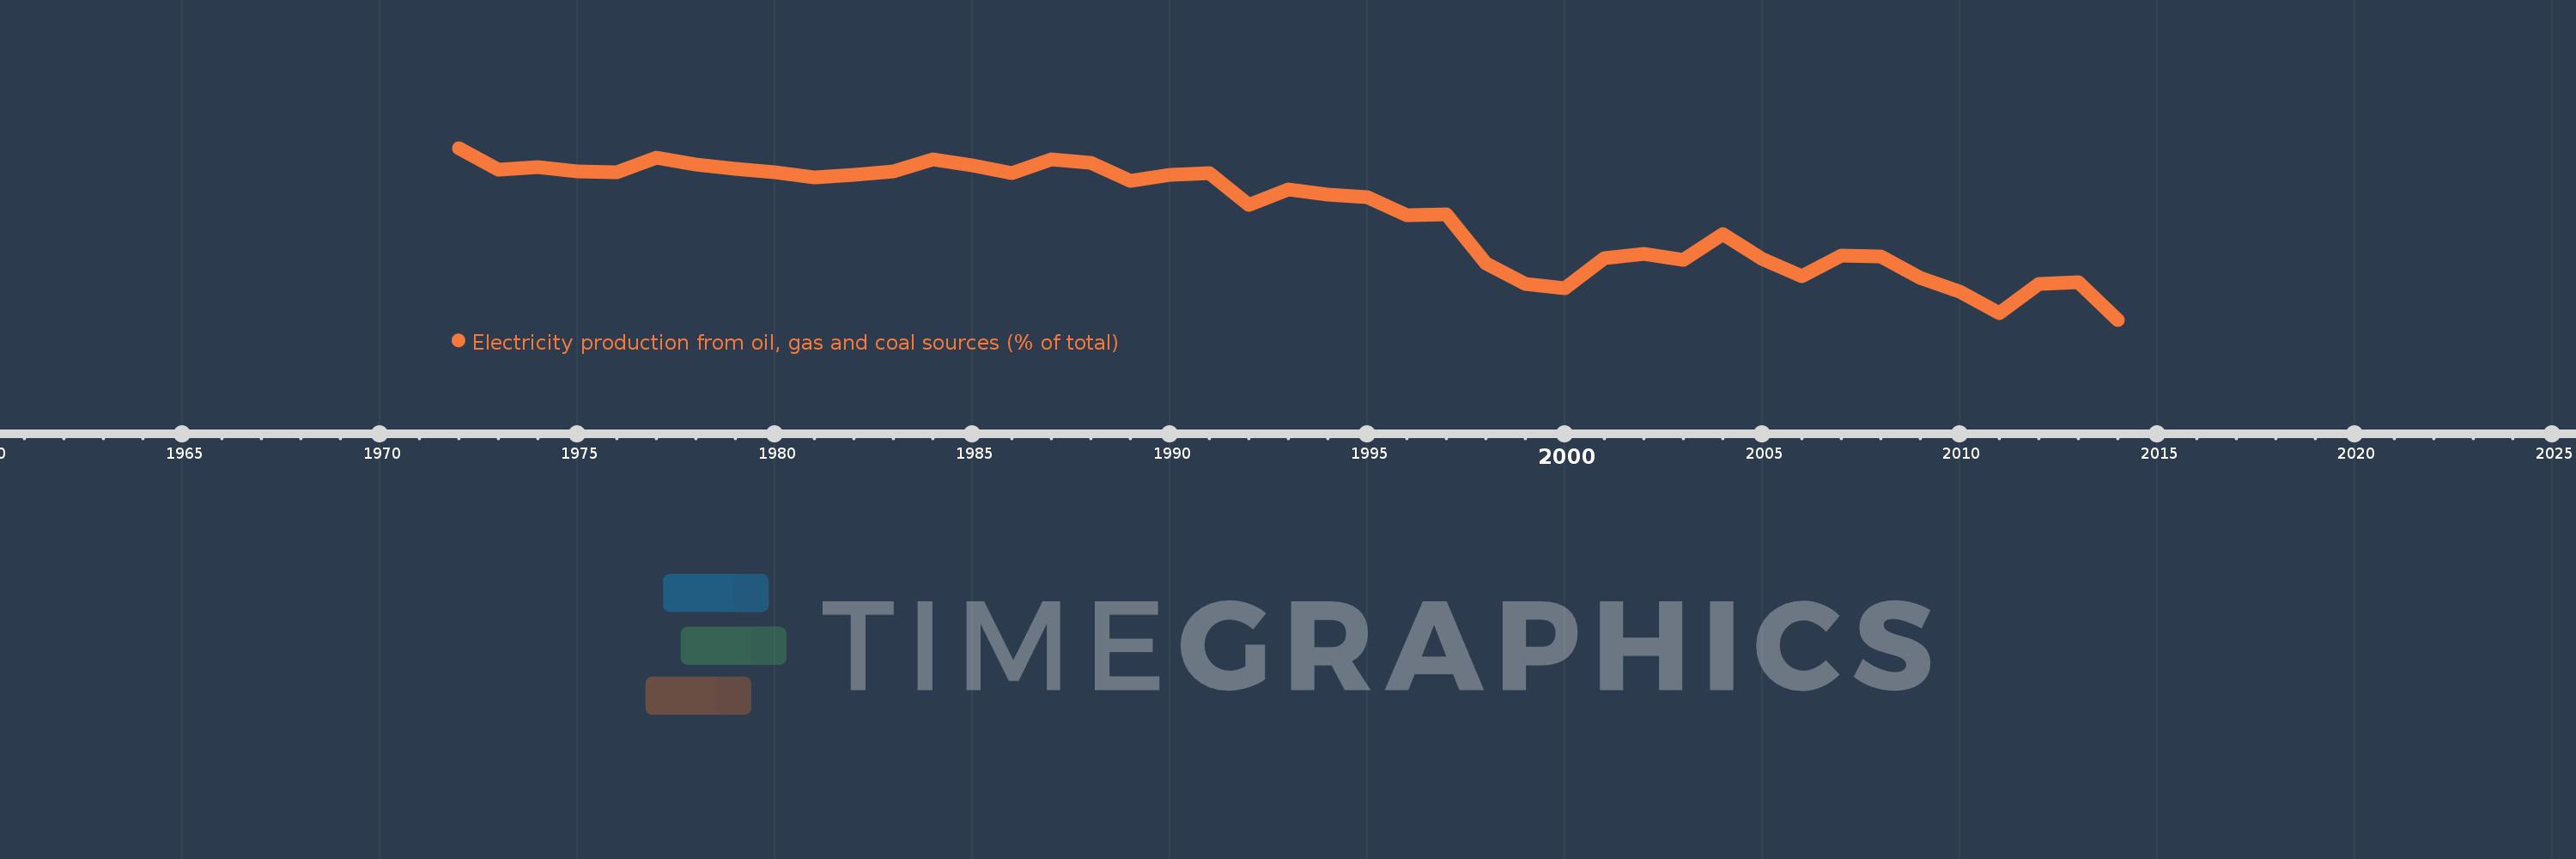
Electricity production from oil, gas and coal sources (% of total)
2014,2013,2012,2011,2010,2009,2008,2007,2006,2005,2004,2003,2002,2001,2000,1999,1998,1997,1996,1995,1994,1993,1992,1991,1990,1989,1988,1987,1986,1985,1984,1983,1982,1981,1980,1979,1978,1977,1976,1975,1974,1973,1972
This statistics in other country:
AlbaniaAlgeriaAngolaArab WorldArgentinaArmeniaAustraliaAustriaAzerbaijanBahrainBangladeshBelarusBelgiumBeninBoliviaBosnia and HerzegovinaBotswanaBrazilBrunei DarussalamBulgariaCambodiaCameroonCanadaCentral Europe and the BalticsChileChinaColombiaCongo, Dem. Rep.Congo, Rep.Costa RicaCote d'IvoireCroatiaCubaCuracaoCyprusCzech RepublicDenmarkDominican RepublicEarly-demographic dividendEast Asia & PacificEast Asia & Pacific (excluding high income)East Asia & Pacific (IDA & IBRD countries)EcuadorEgypt, Arab Rep.El SalvadorEritreaEstoniaEthiopiaEuro areaEurope & Central AsiaEurope & Central Asia (excluding high income)Europe & Central Asia (IDA & IBRD countries)European UnionFinlandFragile and conflict affected situationsFranceGabonGeorgiaGermanyGhanaGibraltarGreeceGuatemalaHaitiHeavily indebted poor countries (HIPC)High incomeHondurasHong Kong SAR, ChinaHungaryIBRD onlyIcelandIDA & IBRD totalIDA blendIDA onlyIDA totalIndiaIndonesiaIran, Islamic Rep.IraqIrelandIsraelItalyJamaicaJapanJordanKazakhstanKenyaKorea, Dem. People’s Rep.Korea, Rep.KosovoKuwaitKyrgyz RepublicLate-demographic dividendLatin America & Caribbean Latin America & Caribbean (excluding high income)Latin America & the Caribbean (IDA & IBRD countries)LatviaLeast developed countries: UN classificationLebanonLibyaLithuaniaLow & middle incomeLower middle incomeLuxembourgMacedonia, FYRMalaysiaMaltaMauritiusMexicoMiddle East & North AfricaMiddle East & North Africa (excluding high income)Middle East & North Africa (IDA & IBRD countries)Middle incomeMoldovaMongoliaMontenegroMoroccoMozambiqueMyanmarNamibiaNepalNetherlandsNew ZealandNicaraguaNigerNigeriaNorth AmericaNorwayOECD membersOmanOther small statesPakistanPanamaParaguayPeruPhilippinesPolandPortugalPost-demographic dividendPre-demographic dividendQatarRomaniaRussian FederationSaudi ArabiaSenegalSerbiaSingaporeSlovak RepublicSloveniaSmall statesSouth AfricaSouth AsiaSouth Asia (IDA & IBRD)South SudanSpainSri LankaSub-Saharan Africa Sub-Saharan Africa (excluding high income)Sub-Saharan Africa (IDA & IBRD countries)SudanSwedenSwitzerlandSyrian Arab RepublicTajikistanTanzaniaThailandTogoTrinidad and TobagoTunisiaTurkeyTurkmenistanUkraineUnited Arab EmiratesUnited KingdomUnited StatesUpper middle incomeUruguayUzbekistanVenezuela, RBVietnamWorldYemen, Rep.ZambiaZimbabwe Timeline:
This timeline shows a graph from 1972 to 2014 of Romania. No data until 1971. Number of actual observations by date: 43.
Source name:
World Development Indicators
Source organization:
IEA Statistics © OECD/IEA 2014 (http://www.iea.org/stats/index.asp), subject to https://www.iea.org/t&c/termsandconditions/
Categories, topics:
Energy & Mining, Environment
Last updated:
apr 23, 2017
Indicators value changes by year
Minimum:
45.731
jan 1, 2014
Maximum:
88.607
jan 1, 1972
At the date of observation
Value
Absolute change
Change from previous value
jan 1, 1972
88.607
+88.607
0.0%
jan 1, 1973
83.096
-5.511
-6.22%
jan 1, 1974
83.867
+0.771
0.93%
jan 1, 1975
82.724
-1.143
-1.36%
jan 1, 1976
82.575
-0.149
-0.18%
jan 1, 1977
86.086
+3.511
4.25%
jan 1, 1978
84.388
-1.698
-1.97%
jan 1, 1979
83.481
-0.907
-1.07%
jan 1, 1980
82.537
-0.944
-1.13%
jan 1, 1981
81.275
-1.263
-1.53%
jan 1, 1982
81.84
+0.565
0.7%
jan 1, 1983
82.801
+0.961
1.17%
jan 1, 1984
85.713
+2.912
3.52%
jan 1, 1985
84.196
-1.517
-1.77%
jan 1, 1986
82.298
-1.898
-2.25%
jan 1, 1987
85.678
+3.38
4.11%
jan 1, 1988
84.868
-0.809
-0.94%
jan 1, 1989
80.383
-4.486
-5.29%
jan 1, 1990
81.967
+1.584
1.97%
jan 1, 1991
82.256
+0.289
0.35%
jan 1, 1992
74.318
-7.938
-9.65%
jan 1, 1993
78.306
+3.988
5.37%
jan 1, 1994
76.86
-1.446
-1.85%
jan 1, 1995
76.339
-0.522
-0.68%
jan 1, 1996
71.829
-4.51
-5.91%
jan 1, 1997
72.06
+0.232
0.32%
jan 1, 1998
59.894
-12.167
-16.88%
jan 1, 1999
54.769
-5.125
-8.56%
jan 1, 2000
53.682
-1.087
-1.98%
jan 1, 2001
61.039
+7.357
13.71%
jan 1, 2002
62.186
+1.147
1.88%
jan 1, 2003
60.607
-1.579
-2.54%
jan 1, 2004
67.051
+6.445
10.63%
jan 1, 2005
60.946
-6.105
-9.1%
jan 1, 2006
56.627
-4.319
-7.09%
jan 1, 2007
61.733
+5.106
9.02%
jan 1, 2008
61.55
-0.183
-0.3%
jan 1, 2009
56.201
-5.349
-8.69%
jan 1, 2010
52.711
-3.49
-6.21%
jan 1, 2011
47.338
-5.373
-10.19%
jan 1, 2012
54.738
+7.4
15.63%
jan 1, 2013
55.096
+0.358
0.65%
jan 1, 2014
45.731
-9.365
-17.0%
Ranking of countries by current statistics by years


Comments: