29
/
en
AIzaSyAYiBZKx7MnpbEhh9jyipgxe19OcubqV5w
April 1, 2024
245465
South Africa
ZAF
true
2
1
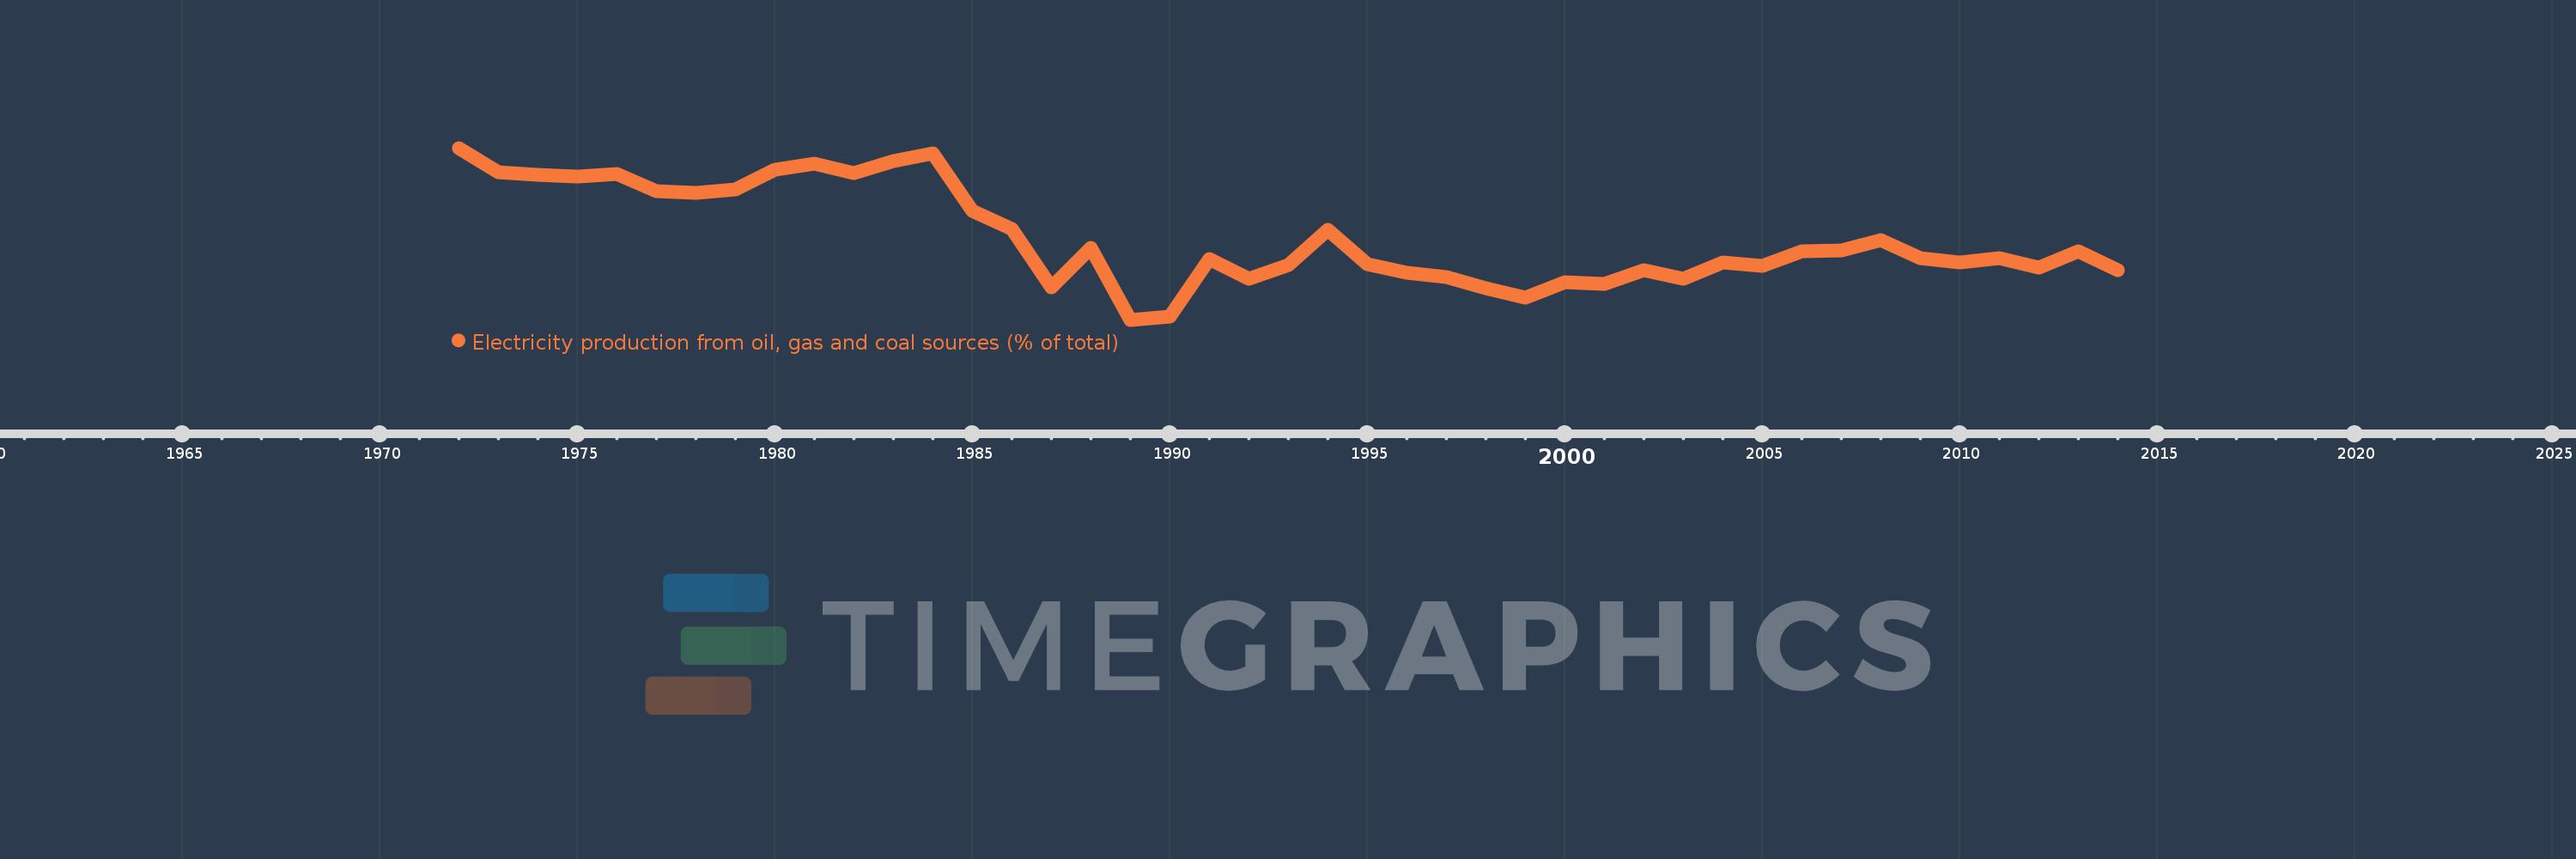
Electricity production from oil, gas and coal sources (% of total)
2014,2013,2012,2011,2010,2009,2008,2007,2006,2005,2004,2003,2002,2001,2000,1999,1998,1997,1996,1995,1994,1993,1992,1991,1990,1989,1988,1987,1986,1985,1984,1983,1982,1981,1980,1979,1978,1977,1976,1975,1974,1973,1972
This statistics in other country:
AlbaniaAlgeriaAngolaArab WorldArgentinaArmeniaAustraliaAustriaAzerbaijanBahrainBangladeshBelarusBelgiumBeninBoliviaBosnia and HerzegovinaBotswanaBrazilBrunei DarussalamBulgariaCambodiaCameroonCanadaCentral Europe and the BalticsChileChinaColombiaCongo, Dem. Rep.Congo, Rep.Costa RicaCote d'IvoireCroatiaCubaCuracaoCyprusCzech RepublicDenmarkDominican RepublicEarly-demographic dividendEast Asia & PacificEast Asia & Pacific (excluding high income)East Asia & Pacific (IDA & IBRD countries)EcuadorEgypt, Arab Rep.El SalvadorEritreaEstoniaEthiopiaEuro areaEurope & Central AsiaEurope & Central Asia (excluding high income)Europe & Central Asia (IDA & IBRD countries)European UnionFinlandFragile and conflict affected situationsFranceGabonGeorgiaGermanyGhanaGibraltarGreeceGuatemalaHaitiHeavily indebted poor countries (HIPC)High incomeHondurasHong Kong SAR, ChinaHungaryIBRD onlyIcelandIDA & IBRD totalIDA blendIDA onlyIDA totalIndiaIndonesiaIran, Islamic Rep.IraqIrelandIsraelItalyJamaicaJapanJordanKazakhstanKenyaKorea, Dem. People’s Rep.Korea, Rep.KosovoKuwaitKyrgyz RepublicLate-demographic dividendLatin America & Caribbean Latin America & Caribbean (excluding high income)Latin America & the Caribbean (IDA & IBRD countries)LatviaLeast developed countries: UN classificationLebanonLibyaLithuaniaLow & middle incomeLower middle incomeLuxembourgMacedonia, FYRMalaysiaMaltaMauritiusMexicoMiddle East & North AfricaMiddle East & North Africa (excluding high income)Middle East & North Africa (IDA & IBRD countries)Middle incomeMoldovaMongoliaMontenegroMoroccoMozambiqueMyanmarNamibiaNepalNetherlandsNew ZealandNicaraguaNigerNigeriaNorth AmericaNorwayOECD membersOmanOther small statesPakistanPanamaParaguayPeruPhilippinesPolandPortugalPost-demographic dividendPre-demographic dividendQatarRomaniaRussian FederationSaudi ArabiaSenegalSerbiaSingaporeSlovak RepublicSloveniaSmall statesSouth AfricaSouth AsiaSouth Asia (IDA & IBRD)South SudanSpainSri LankaSub-Saharan Africa Sub-Saharan Africa (excluding high income)Sub-Saharan Africa (IDA & IBRD countries)SudanSwedenSwitzerlandSyrian Arab RepublicTajikistanTanzaniaThailandTogoTrinidad and TobagoTunisiaTurkeyTurkmenistanUkraineUnited Arab EmiratesUnited KingdomUnited StatesUpper middle incomeUruguayUzbekistanVenezuela, RBVietnamWorldYemen, Rep.ZambiaZimbabwe Timeline:
This timeline shows a graph from 1972 to 2014 of South Africa. No data until 1971. Number of actual observations by date: 43.
Source name:
World Development Indicators
Source organization:
IEA Statistics © OECD/IEA 2014 (http://www.iea.org/stats/index.asp), subject to https://www.iea.org/t&c/termsandconditions/
Categories, topics:
Energy & Mining, Environment
Last updated:
apr 23, 2017
Indicators value changes by year
Minimum:
91.288
jan 1, 1989
Maximum:
99.795
jan 1, 1972
At the date of observation
Value
Absolute change
Change from previous value
jan 1, 1972
99.795
+99.795
0.0%
jan 1, 1973
98.599
-1.196
-1.2%
jan 1, 1974
98.47
-0.128
-0.13%
jan 1, 1975
98.375
-0.096
-0.1%
jan 1, 1976
98.505
+0.13
0.13%
jan 1, 1977
97.636
-0.869
-0.88%
jan 1, 1978
97.58
-0.056
-0.06%
jan 1, 1979
97.743
+0.163
0.17%
jan 1, 1980
98.725
+0.982
1.0%
jan 1, 1981
98.997
+0.272
0.28%
jan 1, 1982
98.546
-0.452
-0.46%
jan 1, 1983
99.146
+0.601
0.61%
jan 1, 1984
99.509
+0.362
0.37%
jan 1, 1985
96.684
-2.825
-2.84%
jan 1, 1986
95.799
-0.885
-0.92%
jan 1, 1987
92.881
-2.918
-3.05%
jan 1, 1988
94.831
+1.95
2.1%
jan 1, 1989
91.288
-3.543
-3.74%
jan 1, 1990
91.463
+0.175
0.19%
jan 1, 1991
94.281
+2.818
3.08%
jan 1, 1992
93.319
-0.961
-1.02%
jan 1, 1993
93.979
+0.66
0.71%
jan 1, 1994
95.731
+1.752
1.86%
jan 1, 1995
94.022
-1.709
-1.79%
jan 1, 1996
93.619
-0.403
-0.43%
jan 1, 1997
93.406
-0.212
-0.23%
jan 1, 1998
92.835
-0.571
-0.61%
jan 1, 1999
92.399
-0.437
-0.47%
jan 1, 2000
93.134
+0.736
0.8%
jan 1, 2001
93.063
-0.072
-0.08%
jan 1, 2002
93.75
+0.687
0.74%
jan 1, 2003
93.305
-0.445
-0.47%
jan 1, 2004
94.106
+0.801
0.86%
jan 1, 2005
93.945
-0.162
-0.17%
jan 1, 2006
94.67
+0.725
0.77%
jan 1, 2007
94.736
+0.066
0.07%
jan 1, 2008
95.213
+0.477
0.5%
jan 1, 2009
94.323
-0.89
-0.93%
jan 1, 2010
94.118
-0.205
-0.22%
jan 1, 2011
94.338
+0.22
0.23%
jan 1, 2012
93.88
-0.458
-0.49%
jan 1, 2013
94.693
+0.813
0.87%
jan 1, 2014
93.743
-0.95
-1.0%
Ranking of countries by current statistics by years


Comments: