29
/
en
AIzaSyAYiBZKx7MnpbEhh9jyipgxe19OcubqV5w
April 1, 2024
41362
Latin America & Caribbean
LCN
false
2
1
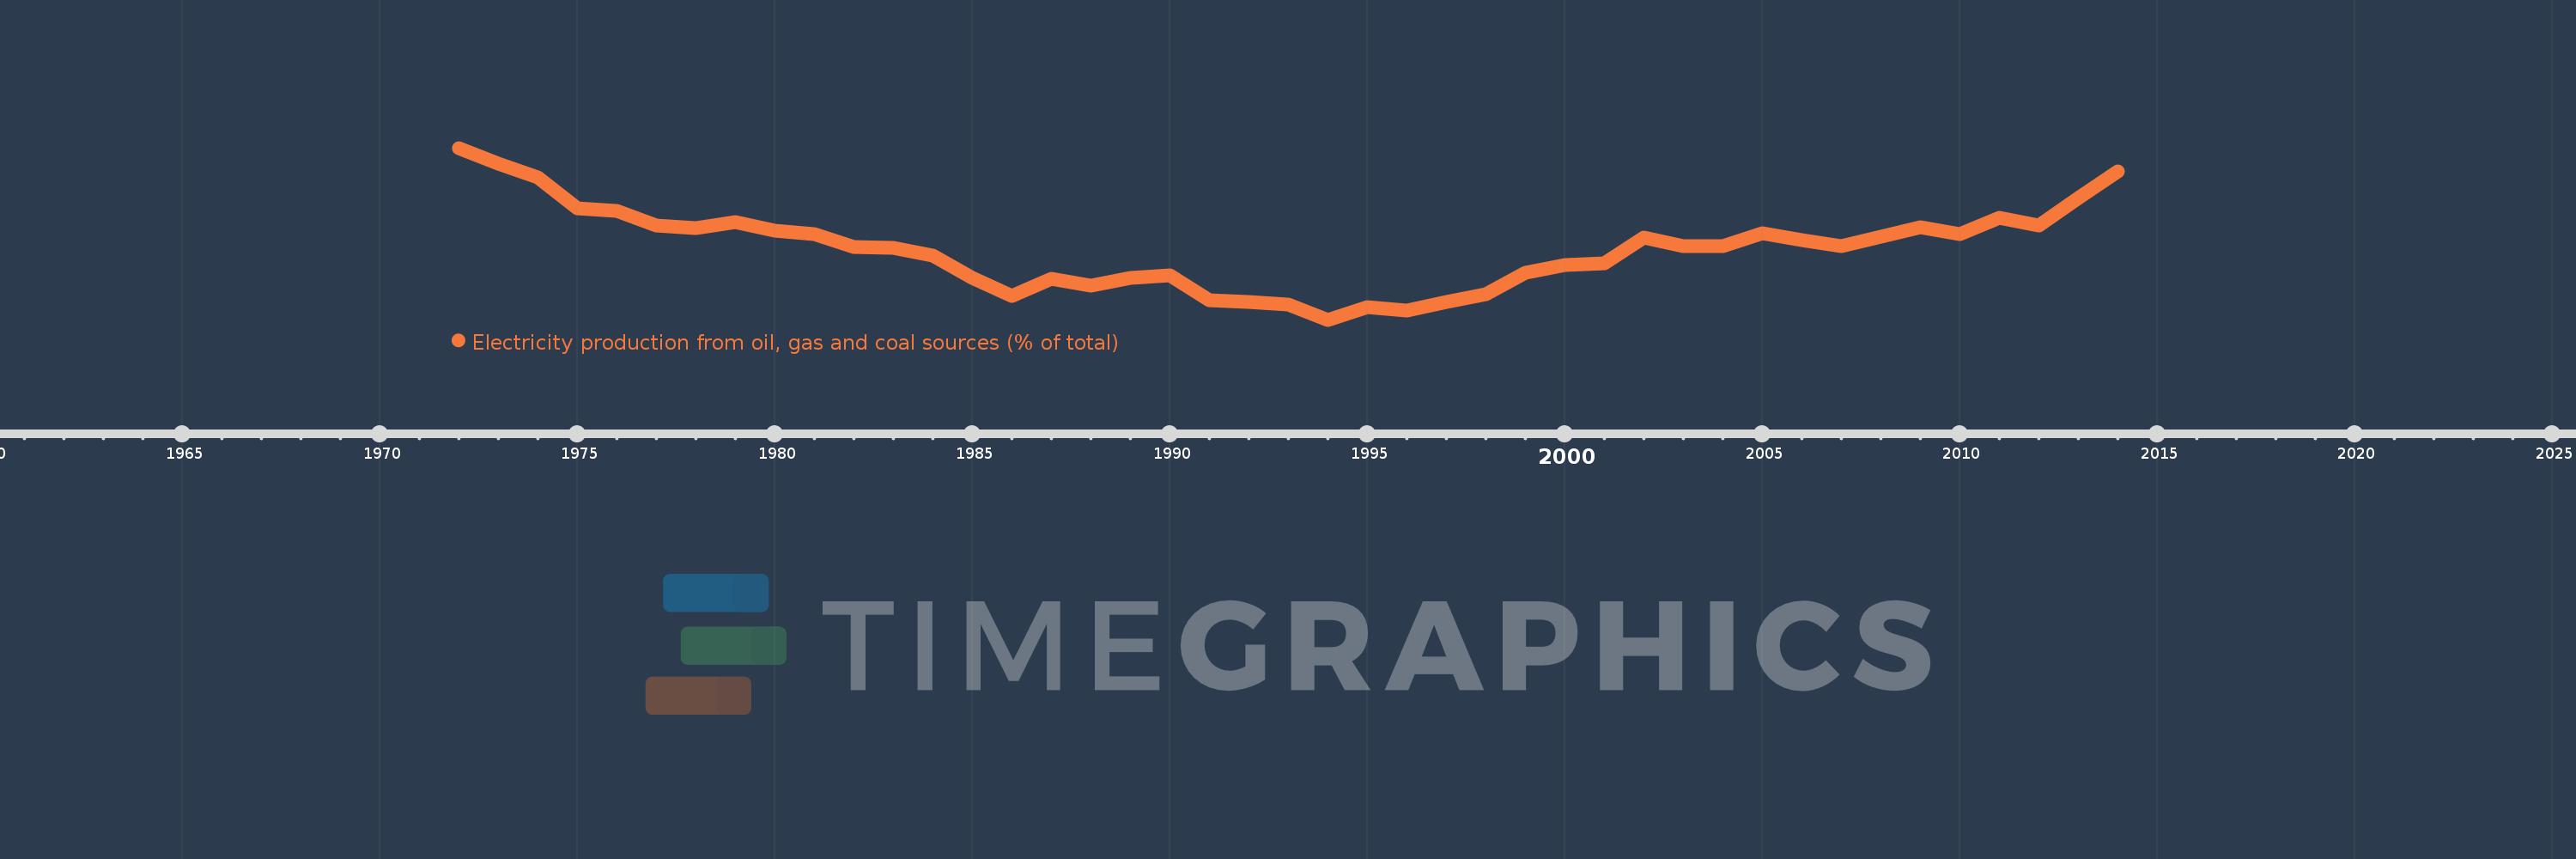
Electricity production from oil, gas and coal sources (% of total)
2014,2013,2012,2011,2010,2009,2008,2007,2006,2005,2004,2003,2002,2001,2000,1999,1998,1997,1996,1995,1994,1993,1992,1991,1990,1989,1988,1987,1986,1985,1984,1983,1982,1981,1980,1979,1978,1977,1976,1975,1974,1973,1972
This statistics in other country:
AlbaniaAlgeriaAngolaArab WorldArgentinaArmeniaAustraliaAustriaAzerbaijanBahrainBangladeshBelarusBelgiumBeninBoliviaBosnia and HerzegovinaBotswanaBrazilBrunei DarussalamBulgariaCambodiaCameroonCanadaCentral Europe and the BalticsChileChinaColombiaCongo, Dem. Rep.Congo, Rep.Costa RicaCote d'IvoireCroatiaCubaCuracaoCyprusCzech RepublicDenmarkDominican RepublicEarly-demographic dividendEast Asia & PacificEast Asia & Pacific (excluding high income)East Asia & Pacific (IDA & IBRD countries)EcuadorEgypt, Arab Rep.El SalvadorEritreaEstoniaEthiopiaEuro areaEurope & Central AsiaEurope & Central Asia (excluding high income)Europe & Central Asia (IDA & IBRD countries)European UnionFinlandFragile and conflict affected situationsFranceGabonGeorgiaGermanyGhanaGibraltarGreeceGuatemalaHaitiHeavily indebted poor countries (HIPC)High incomeHondurasHong Kong SAR, ChinaHungaryIBRD onlyIcelandIDA & IBRD totalIDA blendIDA onlyIDA totalIndiaIndonesiaIran, Islamic Rep.IraqIrelandIsraelItalyJamaicaJapanJordanKazakhstanKenyaKorea, Dem. People’s Rep.Korea, Rep.KosovoKuwaitKyrgyz RepublicLate-demographic dividendLatin America & Caribbean Latin America & Caribbean (excluding high income)Latin America & the Caribbean (IDA & IBRD countries)LatviaLeast developed countries: UN classificationLebanonLibyaLithuaniaLow & middle incomeLower middle incomeLuxembourgMacedonia, FYRMalaysiaMaltaMauritiusMexicoMiddle East & North AfricaMiddle East & North Africa (excluding high income)Middle East & North Africa (IDA & IBRD countries)Middle incomeMoldovaMongoliaMontenegroMoroccoMozambiqueMyanmarNamibiaNepalNetherlandsNew ZealandNicaraguaNigerNigeriaNorth AmericaNorwayOECD membersOmanOther small statesPakistanPanamaParaguayPeruPhilippinesPolandPortugalPost-demographic dividendPre-demographic dividendQatarRomaniaRussian FederationSaudi ArabiaSenegalSerbiaSingaporeSlovak RepublicSloveniaSmall statesSouth AfricaSouth AsiaSouth Asia (IDA & IBRD)South SudanSpainSri LankaSub-Saharan Africa Sub-Saharan Africa (excluding high income)Sub-Saharan Africa (IDA & IBRD countries)SudanSwedenSwitzerlandSyrian Arab RepublicTajikistanTanzaniaThailandTogoTrinidad and TobagoTunisiaTurkeyTurkmenistanUkraineUnited Arab EmiratesUnited KingdomUnited StatesUpper middle incomeUruguayUzbekistanVenezuela, RBVietnamWorldYemen, Rep.ZambiaZimbabwe Timeline:
This timeline shows a graph from 1972 to 2014 of Latin America & Caribbean . No data until 1971. Number of actual observations by date: 43.
Source name:
World Development Indicators
Source organization:
IEA Statistics © OECD/IEA 2014 (http://www.iea.org/stats/index.asp), subject to https://www.iea.org/t&c/termsandconditions/
Categories, topics:
Energy & Mining, Environment
Last updated:
apr 23, 2017
Indicators value changes by year
Minimum:
29.138
jan 1, 1994
Maximum:
45.085
jan 1, 1972
At the date of observation
Value
Absolute change
Change from previous value
jan 1, 1972
45.085
+45.085
0.0%
jan 1, 1973
43.588
-1.497
-3.32%
jan 1, 1974
42.314
-1.274
-2.92%
jan 1, 1975
39.446
-2.868
-6.78%
jan 1, 1976
39.247
-0.199
-0.5%
jan 1, 1977
37.853
-1.394
-3.55%
jan 1, 1978
37.66
-0.194
-0.51%
jan 1, 1979
38.215
+0.555
1.47%
jan 1, 1980
37.397
-0.818
-2.14%
jan 1, 1981
37.069
-0.327
-0.88%
jan 1, 1982
35.902
-1.168
-3.15%
jan 1, 1983
35.835
-0.067
-0.19%
jan 1, 1984
35.067
-0.768
-2.14%
jan 1, 1985
33.034
-2.033
-5.8%
jan 1, 1986
31.356
-1.678
-5.08%
jan 1, 1987
32.907
+1.551
4.95%
jan 1, 1988
32.277
-0.63
-1.91%
jan 1, 1989
33.025
+0.748
2.32%
jan 1, 1990
33.269
+0.245
0.74%
jan 1, 1991
30.938
-2.332
-7.01%
jan 1, 1992
30.81
-0.128
-0.41%
jan 1, 1993
30.531
-0.279
-0.91%
jan 1, 1994
29.138
-1.393
-4.56%
jan 1, 1995
30.324
+1.186
4.07%
jan 1, 1996
29.999
-0.325
-1.07%
jan 1, 1997
30.773
+0.775
2.58%
jan 1, 1998
31.532
+0.759
2.47%
jan 1, 1999
33.536
+2.004
6.36%
jan 1, 2000
34.255
+0.719
2.14%
jan 1, 2001
34.411
+0.156
0.46%
jan 1, 2002
36.784
+2.373
6.89%
jan 1, 2003
35.957
-0.827
-2.25%
jan 1, 2004
36.004
+0.047
0.13%
jan 1, 2005
37.17
+1.166
3.24%
jan 1, 2006
36.491
-0.679
-1.83%
jan 1, 2007
35.962
-0.529
-1.45%
jan 1, 2008
36.828
+0.866
2.41%
jan 1, 2009
37.74
+0.912
2.48%
jan 1, 2010
37.119
-0.621
-1.64%
jan 1, 2011
38.587
+1.468
3.95%
jan 1, 2012
37.924
-0.663
-1.72%
jan 1, 2013
40.405
+2.481
6.54%
jan 1, 2014
42.879
+2.474
6.12%
Ranking of countries by current statistics by years


Comments: