29
/
en
AIzaSyAYiBZKx7MnpbEhh9jyipgxe19OcubqV5w
April 1, 2024
194104
Mauritius
MUS
true
2
1
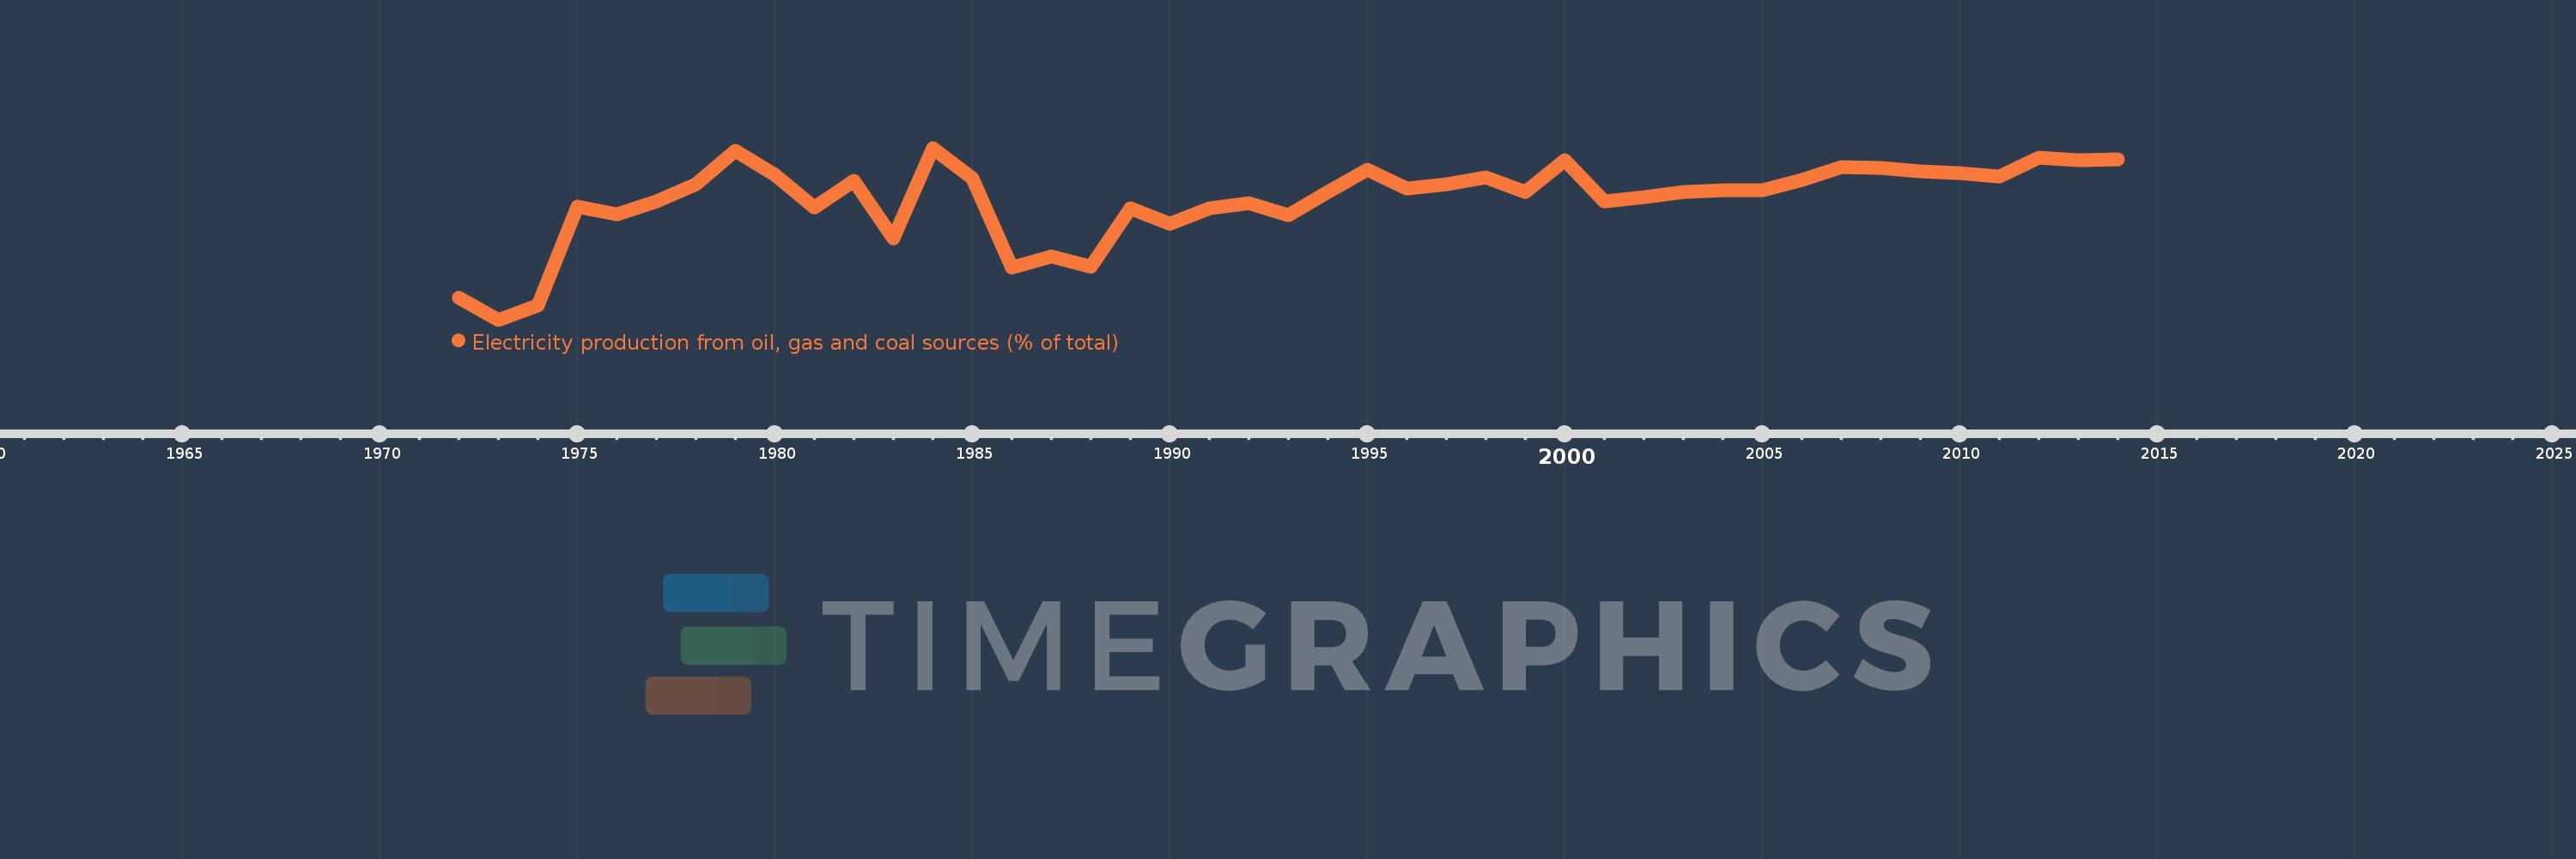
Electricity production from oil, gas and coal sources (% of total)
2014,2013,2012,2011,2010,2009,2008,2007,2006,2005,2004,2003,2002,2001,2000,1999,1998,1997,1996,1995,1994,1993,1992,1991,1990,1989,1988,1987,1986,1985,1984,1983,1982,1981,1980,1979,1978,1977,1976,1975,1974,1973,1972
This statistics in other country:
AlbaniaAlgeriaAngolaArab WorldArgentinaArmeniaAustraliaAustriaAzerbaijanBahrainBangladeshBelarusBelgiumBeninBoliviaBosnia and HerzegovinaBotswanaBrazilBrunei DarussalamBulgariaCambodiaCameroonCanadaCentral Europe and the BalticsChileChinaColombiaCongo, Dem. Rep.Congo, Rep.Costa RicaCote d'IvoireCroatiaCubaCuracaoCyprusCzech RepublicDenmarkDominican RepublicEarly-demographic dividendEast Asia & PacificEast Asia & Pacific (excluding high income)East Asia & Pacific (IDA & IBRD countries)EcuadorEgypt, Arab Rep.El SalvadorEritreaEstoniaEthiopiaEuro areaEurope & Central AsiaEurope & Central Asia (excluding high income)Europe & Central Asia (IDA & IBRD countries)European UnionFinlandFragile and conflict affected situationsFranceGabonGeorgiaGermanyGhanaGibraltarGreeceGuatemalaHaitiHeavily indebted poor countries (HIPC)High incomeHondurasHong Kong SAR, ChinaHungaryIBRD onlyIcelandIDA & IBRD totalIDA blendIDA onlyIDA totalIndiaIndonesiaIran, Islamic Rep.IraqIrelandIsraelItalyJamaicaJapanJordanKazakhstanKenyaKorea, Dem. People’s Rep.Korea, Rep.KosovoKuwaitKyrgyz RepublicLate-demographic dividendLatin America & Caribbean Latin America & Caribbean (excluding high income)Latin America & the Caribbean (IDA & IBRD countries)LatviaLeast developed countries: UN classificationLebanonLibyaLithuaniaLow & middle incomeLower middle incomeLuxembourgMacedonia, FYRMalaysiaMaltaMauritiusMexicoMiddle East & North AfricaMiddle East & North Africa (excluding high income)Middle East & North Africa (IDA & IBRD countries)Middle incomeMoldovaMongoliaMontenegroMoroccoMozambiqueMyanmarNamibiaNepalNetherlandsNew ZealandNicaraguaNigerNigeriaNorth AmericaNorwayOECD membersOmanOther small statesPakistanPanamaParaguayPeruPhilippinesPolandPortugalPost-demographic dividendPre-demographic dividendQatarRomaniaRussian FederationSaudi ArabiaSenegalSerbiaSingaporeSlovak RepublicSloveniaSmall statesSouth AfricaSouth AsiaSouth Asia (IDA & IBRD)South SudanSpainSri LankaSub-Saharan Africa Sub-Saharan Africa (excluding high income)Sub-Saharan Africa (IDA & IBRD countries)SudanSwedenSwitzerlandSyrian Arab RepublicTajikistanTanzaniaThailandTogoTrinidad and TobagoTunisiaTurkeyTurkmenistanUkraineUnited Arab EmiratesUnited KingdomUnited StatesUpper middle incomeUruguayUzbekistanVenezuela, RBVietnamWorldYemen, Rep.ZambiaZimbabwe Timeline:
This timeline shows a graph from 1972 to 2014 of Mauritius. No data until 1971. Number of actual observations by date: 43.
Source name:
World Development Indicators
Source organization:
IEA Statistics © OECD/IEA 2014 (http://www.iea.org/stats/index.asp), subject to https://www.iea.org/t&c/termsandconditions/
Categories, topics:
Energy & Mining, Environment
Last updated:
apr 23, 2017
Indicators value changes by year
Minimum:
44.512
jan 1, 1973
Maximum:
81.941
jan 1, 1984
At the date of observation
Value
Absolute change
Change from previous value
jan 1, 1972
49.324
+49.324
0.0%
jan 1, 1973
44.512
-4.812
-9.76%
jan 1, 1974
47.594
+3.081
6.92%
jan 1, 1975
69.231
+21.637
45.46%
jan 1, 1976
67.411
-1.82
-2.63%
jan 1, 1977
70.37
+2.96
4.39%
jan 1, 1978
74.026
+3.656
5.19%
jan 1, 1979
81.27
+7.244
9.79%
jan 1, 1980
76.056
-5.214
-6.42%
jan 1, 1981
69.014
-7.042
-9.26%
jan 1, 1982
74.862
+5.848
8.47%
jan 1, 1983
62.259
-12.603
-16.83%
jan 1, 1984
81.941
+19.682
31.61%
jan 1, 1985
75.263
-6.678
-8.15%
jan 1, 1986
55.867
-19.396
-25.77%
jan 1, 1987
58.314
+2.447
4.38%
jan 1, 1988
56.057
-2.257
-3.87%
jan 1, 1989
68.727
+12.67
22.6%
jan 1, 1990
65.365
-3.362
-4.89%
jan 1, 1991
68.846
+3.481
5.33%
jan 1, 1992
69.895
+1.049
1.52%
jan 1, 1993
67.312
-2.583
-3.7%
jan 1, 1994
72.295
+4.983
7.4%
jan 1, 1995
77.195
+4.899
6.78%
jan 1, 1996
73.156
-4.039
-5.23%
jan 1, 1997
74.077
+0.921
1.26%
jan 1, 1998
75.482
+1.406
1.9%
jan 1, 1999
72.367
-3.116
-4.13%
jan 1, 2000
79.243
+6.876
9.5%
jan 1, 2001
70.36
-8.883
-11.21%
jan 1, 2002
71.272
+0.912
1.3%
jan 1, 2003
72.41
+1.139
1.6%
jan 1, 2004
72.767
+0.356
0.49%
jan 1, 2005
72.656
-0.111
-0.15%
jan 1, 2006
75.0
+2.344
3.23%
jan 1, 2007
77.745
+2.745
3.66%
jan 1, 2008
77.606
-0.138
-0.18%
jan 1, 2009
76.77
-0.837
-1.08%
jan 1, 2010
76.368
-0.402
-0.52%
jan 1, 2011
75.679
-0.689
-0.9%
jan 1, 2012
79.788
+4.109
5.43%
jan 1, 2013
79.299
-0.488
-0.61%
jan 1, 2014
79.398
+0.098
0.12%
Ranking of countries by current statistics by years


Comments: