29
/
en
AIzaSyAYiBZKx7MnpbEhh9jyipgxe19OcubqV5w
April 1, 2024
154476
India
IND
true
2
1
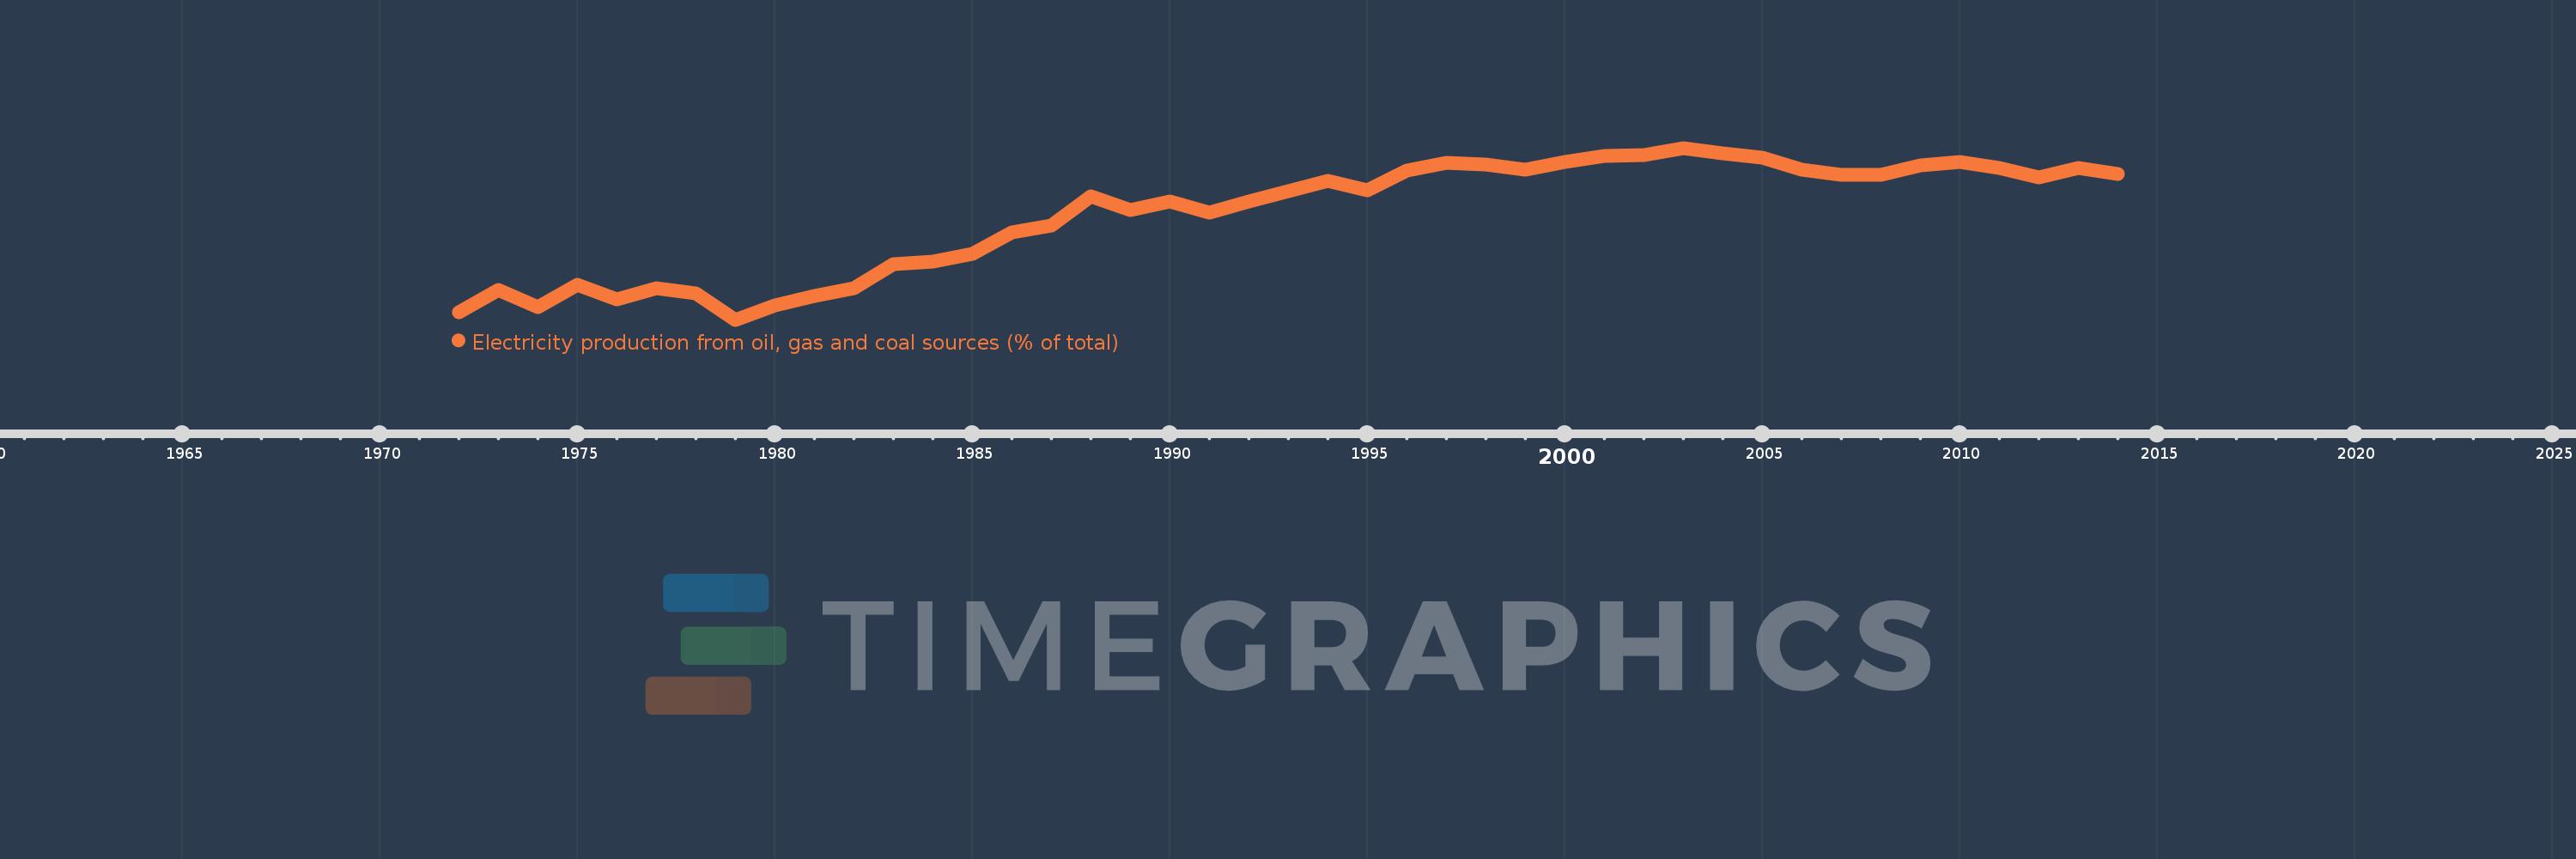
Electricity production from oil, gas and coal sources (% of total)
2014,2013,2012,2011,2010,2009,2008,2007,2006,2005,2004,2003,2002,2001,2000,1999,1998,1997,1996,1995,1994,1993,1992,1991,1990,1989,1988,1987,1986,1985,1984,1983,1982,1981,1980,1979,1978,1977,1976,1975,1974,1973,1972
This statistics in other country:
AlbaniaAlgeriaAngolaArab WorldArgentinaArmeniaAustraliaAustriaAzerbaijanBahrainBangladeshBelarusBelgiumBeninBoliviaBosnia and HerzegovinaBotswanaBrazilBrunei DarussalamBulgariaCambodiaCameroonCanadaCentral Europe and the BalticsChileChinaColombiaCongo, Dem. Rep.Congo, Rep.Costa RicaCote d'IvoireCroatiaCubaCuracaoCyprusCzech RepublicDenmarkDominican RepublicEarly-demographic dividendEast Asia & PacificEast Asia & Pacific (excluding high income)East Asia & Pacific (IDA & IBRD countries)EcuadorEgypt, Arab Rep.El SalvadorEritreaEstoniaEthiopiaEuro areaEurope & Central AsiaEurope & Central Asia (excluding high income)Europe & Central Asia (IDA & IBRD countries)European UnionFinlandFragile and conflict affected situationsFranceGabonGeorgiaGermanyGhanaGibraltarGreeceGuatemalaHaitiHeavily indebted poor countries (HIPC)High incomeHondurasHong Kong SAR, ChinaHungaryIBRD onlyIcelandIDA & IBRD totalIDA blendIDA onlyIDA totalIndiaIndonesiaIran, Islamic Rep.IraqIrelandIsraelItalyJamaicaJapanJordanKazakhstanKenyaKorea, Dem. People’s Rep.Korea, Rep.KosovoKuwaitKyrgyz RepublicLate-demographic dividendLatin America & Caribbean Latin America & Caribbean (excluding high income)Latin America & the Caribbean (IDA & IBRD countries)LatviaLeast developed countries: UN classificationLebanonLibyaLithuaniaLow & middle incomeLower middle incomeLuxembourgMacedonia, FYRMalaysiaMaltaMauritiusMexicoMiddle East & North AfricaMiddle East & North Africa (excluding high income)Middle East & North Africa (IDA & IBRD countries)Middle incomeMoldovaMongoliaMontenegroMoroccoMozambiqueMyanmarNamibiaNepalNetherlandsNew ZealandNicaraguaNigerNigeriaNorth AmericaNorwayOECD membersOmanOther small statesPakistanPanamaParaguayPeruPhilippinesPolandPortugalPost-demographic dividendPre-demographic dividendQatarRomaniaRussian FederationSaudi ArabiaSenegalSerbiaSingaporeSlovak RepublicSloveniaSmall statesSouth AfricaSouth AsiaSouth Asia (IDA & IBRD)South SudanSpainSri LankaSub-Saharan Africa Sub-Saharan Africa (excluding high income)Sub-Saharan Africa (IDA & IBRD countries)SudanSwedenSwitzerlandSyrian Arab RepublicTajikistanTanzaniaThailandTogoTrinidad and TobagoTunisiaTurkeyTurkmenistanUkraineUnited Arab EmiratesUnited KingdomUnited StatesUpper middle incomeUruguayUzbekistanVenezuela, RBVietnamWorldYemen, Rep.ZambiaZimbabwe Timeline:
This timeline shows a graph from 1972 to 2014 of India. No data until 1971. Number of actual observations by date: 43.
Source name:
World Development Indicators
Source organization:
IEA Statistics © OECD/IEA 2014 (http://www.iea.org/stats/index.asp), subject to https://www.iea.org/t&c/termsandconditions/
Categories, topics:
Energy & Mining, Environment
Last updated:
apr 23, 2017
Indicators value changes by year
Minimum:
54.651
jan 1, 1979
Maximum:
84.769
jan 1, 2003
At the date of observation
Value
Absolute change
Change from previous value
jan 1, 1972
55.983
+55.983
0.0%
jan 1, 1973
59.816
+3.833
6.85%
jan 1, 1974
56.9
-2.916
-4.88%
jan 1, 1975
60.761
+3.86
6.78%
jan 1, 1976
58.177
-2.584
-4.25%
jan 1, 1977
60.157
+1.98
3.4%
jan 1, 1978
59.272
-0.884
-1.47%
jan 1, 1979
54.651
-4.621
-7.8%
jan 1, 1980
57.128
+2.476
4.53%
jan 1, 1981
58.842
+1.714
3.0%
jan 1, 1982
60.248
+1.406
2.39%
jan 1, 1983
64.373
+4.125
6.85%
jan 1, 1984
64.778
+0.405
0.63%
jan 1, 1985
66.232
+1.454
2.24%
jan 1, 1986
69.895
+3.663
5.53%
jan 1, 1987
71.132
+1.237
1.77%
jan 1, 1988
76.339
+5.208
7.32%
jan 1, 1989
73.925
-2.414
-3.16%
jan 1, 1990
75.438
+1.514
2.05%
jan 1, 1991
73.413
-2.025
-2.68%
jan 1, 1992
75.462
+2.049
2.79%
jan 1, 1993
77.253
+1.791
2.37%
jan 1, 1994
78.945
+1.693
2.19%
jan 1, 1995
77.336
-1.61
-2.04%
jan 1, 1996
80.855
+3.52
4.55%
jan 1, 1997
82.185
+1.33
1.64%
jan 1, 1998
81.852
-0.334
-0.41%
jan 1, 1999
80.932
-0.919
-1.12%
jan 1, 2000
82.314
+1.382
1.71%
jan 1, 2001
83.442
+1.128
1.37%
jan 1, 2002
83.482
+0.04
0.05%
jan 1, 2003
84.769
+1.287
1.54%
jan 1, 2004
83.794
-0.975
-1.15%
jan 1, 2005
83.02
-0.773
-0.92%
jan 1, 2006
80.949
-2.071
-2.49%
jan 1, 2007
80.016
-0.933
-1.15%
jan 1, 2008
80.052
+0.036
0.04%
jan 1, 2009
81.701
+1.649
2.06%
jan 1, 2010
82.275
+0.574
0.7%
jan 1, 2011
81.236
-1.039
-1.26%
jan 1, 2012
79.632
-1.604
-1.97%
jan 1, 2013
81.287
+1.655
2.08%
jan 1, 2014
80.224
-1.064
-1.31%
Ranking of countries by current statistics by years


Comments: