29
/
en
AIzaSyAYiBZKx7MnpbEhh9jyipgxe19OcubqV5w
April 1, 2024
207837
Netherlands
NLD
true
2
1
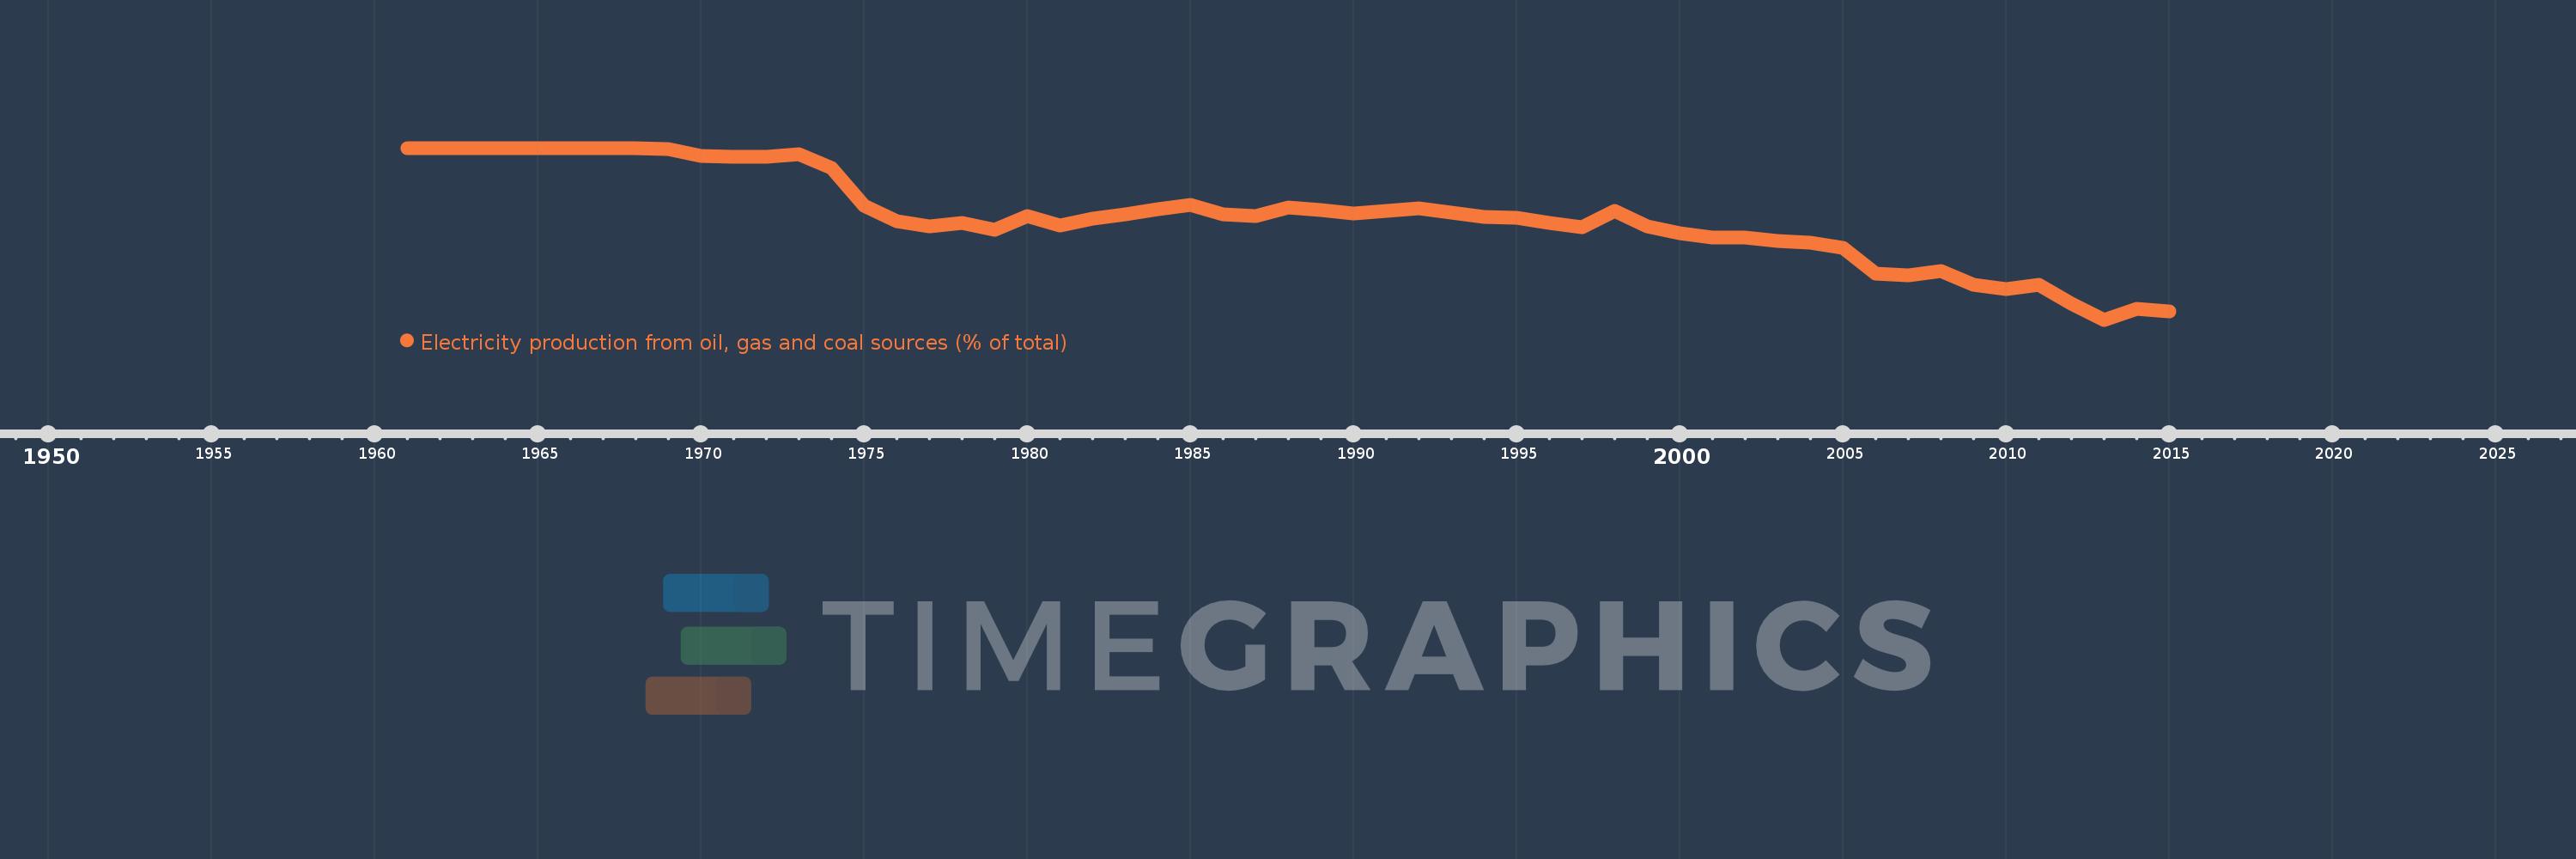
Electricity production from oil, gas and coal sources (% of total)
2015,2014,2013,2012,2011,2010,2009,2008,2007,2006,2005,2004,2003,2002,2001,2000,1999,1998,1997,1996,1995,1994,1993,1992,1991,1990,1989,1988,1987,1986,1985,1984,1983,1982,1981,1980,1979,1978,1977,1976,1975,1974,1973,1972,1971,1970,1969,1968,1967,1966,1965,1964,1963,1962,1961
This statistics in other country:
AlbaniaAlgeriaAngolaArab WorldArgentinaArmeniaAustraliaAustriaAzerbaijanBahrainBangladeshBelarusBelgiumBeninBoliviaBosnia and HerzegovinaBotswanaBrazilBrunei DarussalamBulgariaCambodiaCameroonCanadaCentral Europe and the BalticsChileChinaColombiaCongo, Dem. Rep.Congo, Rep.Costa RicaCote d'IvoireCroatiaCubaCuracaoCyprusCzech RepublicDenmarkDominican RepublicEarly-demographic dividendEast Asia & PacificEast Asia & Pacific (excluding high income)East Asia & Pacific (IDA & IBRD countries)EcuadorEgypt, Arab Rep.El SalvadorEritreaEstoniaEthiopiaEuro areaEurope & Central AsiaEurope & Central Asia (excluding high income)Europe & Central Asia (IDA & IBRD countries)European UnionFinlandFragile and conflict affected situationsFranceGabonGeorgiaGermanyGhanaGibraltarGreeceGuatemalaHaitiHeavily indebted poor countries (HIPC)High incomeHondurasHong Kong SAR, ChinaHungaryIBRD onlyIcelandIDA & IBRD totalIDA blendIDA onlyIDA totalIndiaIndonesiaIran, Islamic Rep.IraqIrelandIsraelItalyJamaicaJapanJordanKazakhstanKenyaKorea, Dem. People’s Rep.Korea, Rep.KosovoKuwaitKyrgyz RepublicLate-demographic dividendLatin America & Caribbean Latin America & Caribbean (excluding high income)Latin America & the Caribbean (IDA & IBRD countries)LatviaLeast developed countries: UN classificationLebanonLibyaLithuaniaLow & middle incomeLower middle incomeLuxembourgMacedonia, FYRMalaysiaMaltaMauritiusMexicoMiddle East & North AfricaMiddle East & North Africa (excluding high income)Middle East & North Africa (IDA & IBRD countries)Middle incomeMoldovaMongoliaMontenegroMoroccoMozambiqueMyanmarNamibiaNepalNetherlandsNew ZealandNicaraguaNigerNigeriaNorth AmericaNorwayOECD membersOmanOther small statesPakistanPanamaParaguayPeruPhilippinesPolandPortugalPost-demographic dividendPre-demographic dividendQatarRomaniaRussian FederationSaudi ArabiaSenegalSerbiaSingaporeSlovak RepublicSloveniaSmall statesSouth AfricaSouth AsiaSouth Asia (IDA & IBRD)South SudanSpainSri LankaSub-Saharan Africa Sub-Saharan Africa (excluding high income)Sub-Saharan Africa (IDA & IBRD countries)SudanSwedenSwitzerlandSyrian Arab RepublicTajikistanTanzaniaThailandTogoTrinidad and TobagoTunisiaTurkeyTurkmenistanUkraineUnited Arab EmiratesUnited KingdomUnited StatesUpper middle incomeUruguayUzbekistanVenezuela, RBVietnamWorldYemen, Rep.ZambiaZimbabwe Timeline:
This timeline shows a graph from 1961 to 2015 of Netherlands. No data until 1960. Number of actual observations by date: 55.
Source name:
World Development Indicators
Source organization:
IEA Statistics © OECD/IEA 2014 (http://www.iea.org/stats/index.asp), subject to https://www.iea.org/t&c/termsandconditions/
Categories, topics:
Energy & Mining, Environment
Last updated:
apr 23, 2017
Indicators value changes by year
Minimum:
82.088
jan 1, 2013
At the date of observation
Value
Absolute change
Change from previous value
jan 1, 1961
100.0
+100.0
0.0%
jan 1, 1962
100.0
0.0
0.0%
jan 1, 1963
100.0
0.0
0.0%
jan 1, 1964
100.0
0.0
0.0%
jan 1, 1965
100.0
0.0
0.0%
jan 1, 1966
100.0
0.0
0.0%
jan 1, 1967
100.0
0.0
0.0%
jan 1, 1968
100.0
0.0
0.0%
jan 1, 1969
99.917
-0.083
-0.08%
jan 1, 1970
99.152
-0.765
-0.77%
jan 1, 1971
99.099
-0.053
-0.05%
jan 1, 1972
99.098
-0.001
0.0%
jan 1, 1973
99.342
+0.244
0.25%
jan 1, 1974
97.895
-1.447
-1.46%
jan 1, 1975
94.016
-3.879
-3.96%
jan 1, 1976
92.373
-1.642
-1.75%
jan 1, 1977
91.84
-0.534
-0.58%
jan 1, 1978
92.147
+0.307
0.33%
jan 1, 1979
91.443
-0.705
-0.76%
jan 1, 1980
92.872
+1.429
1.56%
jan 1, 1981
91.939
-0.933
-1.0%
jan 1, 1982
92.595
+0.656
0.71%
jan 1, 1983
93.099
+0.504
0.54%
jan 1, 1984
93.596
+0.497
0.53%
jan 1, 1985
94.062
+0.466
0.5%
jan 1, 1986
93.101
-0.961
-1.02%
jan 1, 1987
92.893
-0.208
-0.22%
jan 1, 1988
93.772
+0.879
0.95%
jan 1, 1989
93.495
-0.277
-0.3%
jan 1, 1990
93.184
-0.311
-0.33%
jan 1, 1991
93.465
+0.281
0.3%
jan 1, 1992
93.683
+0.218
0.23%
jan 1, 1993
93.233
-0.45
-0.48%
jan 1, 1994
92.778
-0.455
-0.49%
jan 1, 1995
92.752
-0.027
-0.03%
jan 1, 1996
92.192
-0.56
-0.6%
jan 1, 1997
91.712
-0.48
-0.52%
jan 1, 1998
93.454
+1.742
1.9%
jan 1, 1999
91.812
-1.642
-1.76%
jan 1, 2000
91.103
-0.709
-0.77%
jan 1, 2001
90.678
-0.424
-0.47%
jan 1, 2002
90.684
+0.006
0.01%
jan 1, 2003
90.256
-0.428
-0.47%
jan 1, 2004
90.121
-0.135
-0.15%
jan 1, 2005
89.599
-0.522
-0.58%
jan 1, 2006
86.898
-2.701
-3.01%
jan 1, 2007
86.701
-0.196
-0.23%
jan 1, 2008
87.193
+0.492
0.57%
jan 1, 2009
85.775
-1.419
-1.63%
jan 1, 2010
85.282
-0.492
-0.57%
jan 1, 2011
85.706
+0.424
0.5%
jan 1, 2012
83.765
-1.941
-2.26%
jan 1, 2013
82.088
-1.678
-2.0%
jan 1, 2014
83.223
+1.135
1.38%
jan 1, 2015
82.954
-0.268
-0.32%
Ranking of countries by current statistics by years


Comments: