29
/
en
AIzaSyAYiBZKx7MnpbEhh9jyipgxe19OcubqV5w
April 1, 2024
31490
Europe & Central Asia (excluding high income)
ECA
false
2
1
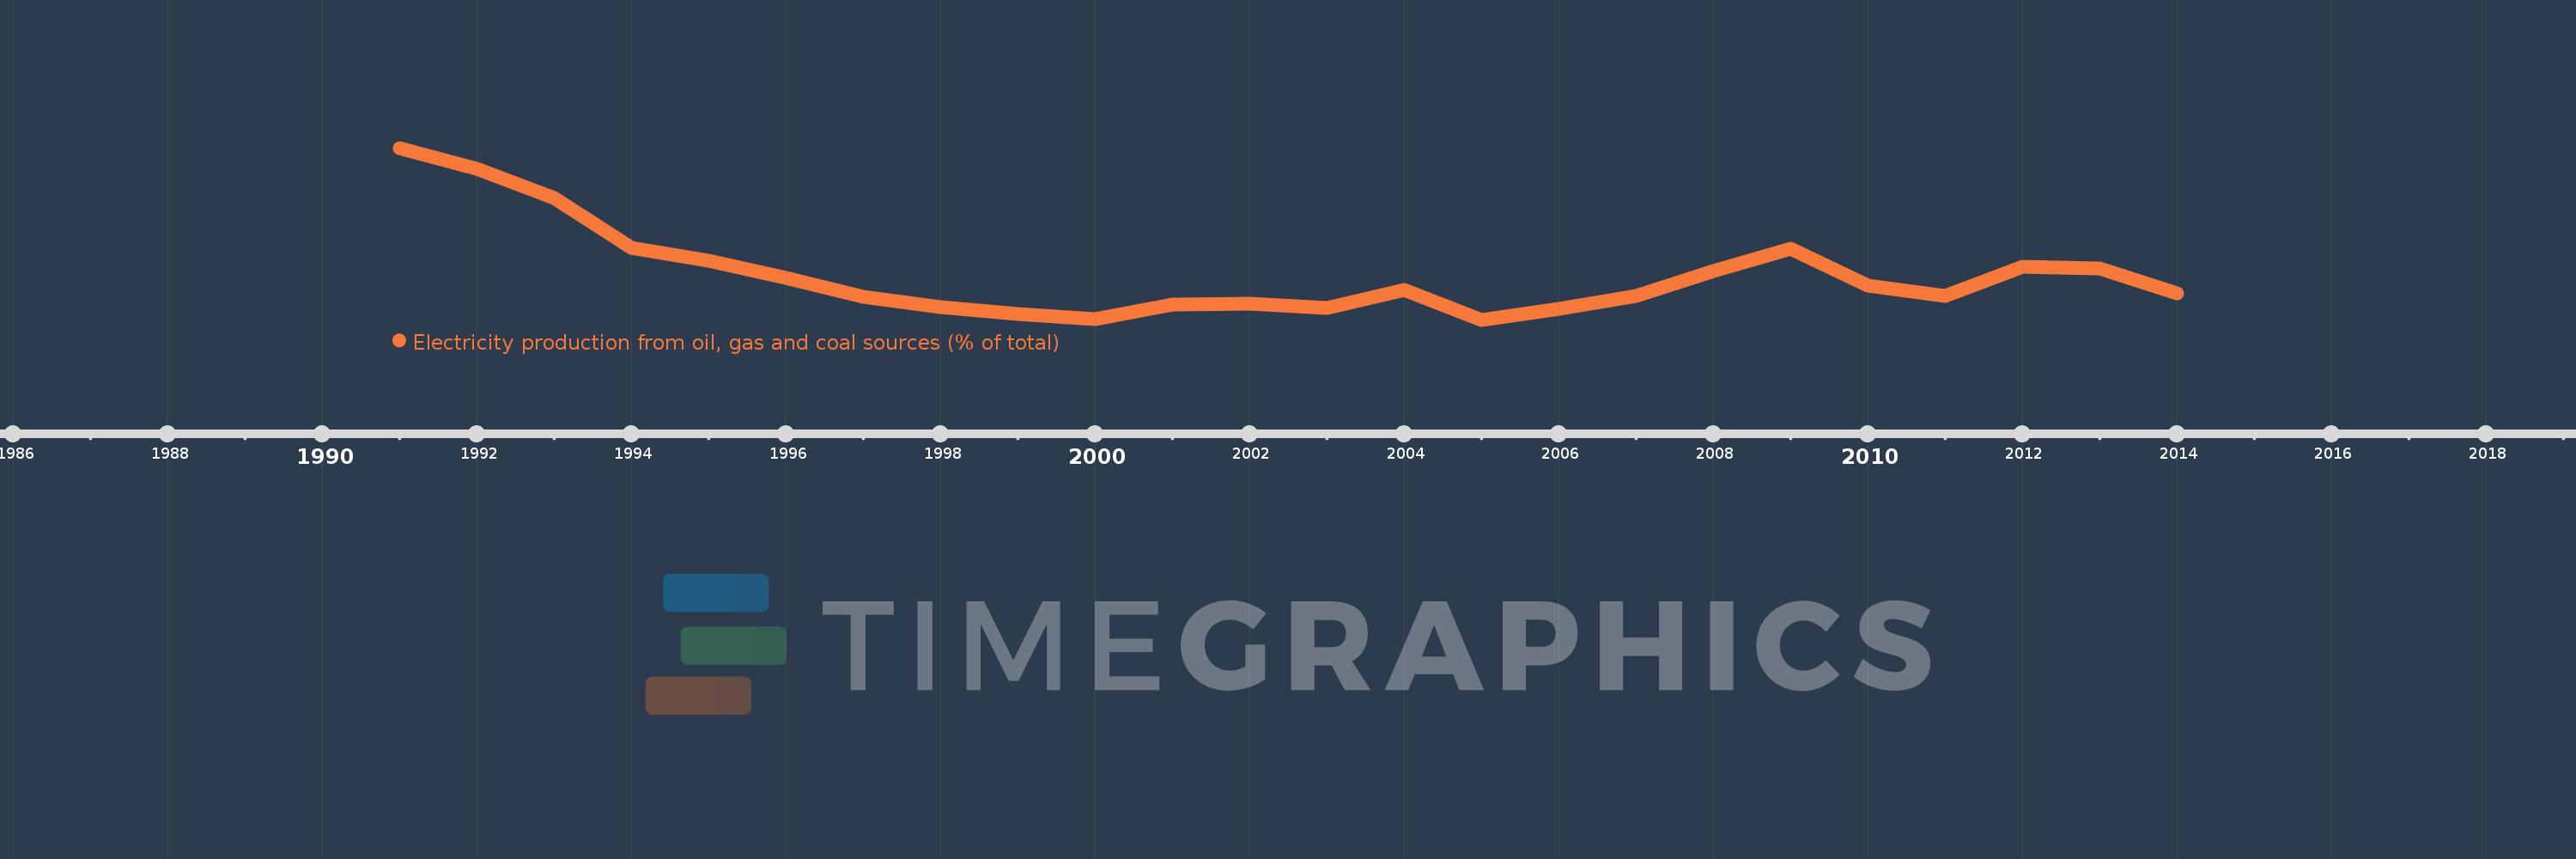
Electricity production from oil, gas and coal sources (% of total)
2014,2013,2012,2011,2010,2009,2008,2007,2006,2005,2004,2003,2002,2001,2000,1999,1998,1997,1996,1995,1994,1993,1992,1991
This statistics in other country:
AlbaniaAlgeriaAngolaArab WorldArgentinaArmeniaAustraliaAustriaAzerbaijanBahrainBangladeshBelarusBelgiumBeninBoliviaBosnia and HerzegovinaBotswanaBrazilBrunei DarussalamBulgariaCambodiaCameroonCanadaCentral Europe and the BalticsChileChinaColombiaCongo, Dem. Rep.Congo, Rep.Costa RicaCote d'IvoireCroatiaCubaCuracaoCyprusCzech RepublicDenmarkDominican RepublicEarly-demographic dividendEast Asia & PacificEast Asia & Pacific (excluding high income)East Asia & Pacific (IDA & IBRD countries)EcuadorEgypt, Arab Rep.El SalvadorEritreaEstoniaEthiopiaEuro areaEurope & Central AsiaEurope & Central Asia (excluding high income)Europe & Central Asia (IDA & IBRD countries)European UnionFinlandFragile and conflict affected situationsFranceGabonGeorgiaGermanyGhanaGibraltarGreeceGuatemalaHaitiHeavily indebted poor countries (HIPC)High incomeHondurasHong Kong SAR, ChinaHungaryIBRD onlyIcelandIDA & IBRD totalIDA blendIDA onlyIDA totalIndiaIndonesiaIran, Islamic Rep.IraqIrelandIsraelItalyJamaicaJapanJordanKazakhstanKenyaKorea, Dem. People’s Rep.Korea, Rep.KosovoKuwaitKyrgyz RepublicLate-demographic dividendLatin America & Caribbean Latin America & Caribbean (excluding high income)Latin America & the Caribbean (IDA & IBRD countries)LatviaLeast developed countries: UN classificationLebanonLibyaLithuaniaLow & middle incomeLower middle incomeLuxembourgMacedonia, FYRMalaysiaMaltaMauritiusMexicoMiddle East & North AfricaMiddle East & North Africa (excluding high income)Middle East & North Africa (IDA & IBRD countries)Middle incomeMoldovaMongoliaMontenegroMoroccoMozambiqueMyanmarNamibiaNepalNetherlandsNew ZealandNicaraguaNigerNigeriaNorth AmericaNorwayOECD membersOmanOther small statesPakistanPanamaParaguayPeruPhilippinesPolandPortugalPost-demographic dividendPre-demographic dividendQatarRomaniaRussian FederationSaudi ArabiaSenegalSerbiaSingaporeSlovak RepublicSloveniaSmall statesSouth AfricaSouth AsiaSouth Asia (IDA & IBRD)South SudanSpainSri LankaSub-Saharan Africa Sub-Saharan Africa (excluding high income)Sub-Saharan Africa (IDA & IBRD countries)SudanSwedenSwitzerlandSyrian Arab RepublicTajikistanTanzaniaThailandTogoTrinidad and TobagoTunisiaTurkeyTurkmenistanUkraineUnited Arab EmiratesUnited KingdomUnited StatesUpper middle incomeUruguayUzbekistanVenezuela, RBVietnamWorldYemen, Rep.ZambiaZimbabwe Timeline:
This timeline shows a graph from 1991 to 2014 of Europe & Central Asia (excluding high income). No data until 1990. Number of actual observations by date: 24.
Source name:
World Development Indicators
Source organization:
IEA Statistics © OECD/IEA 2014 (http://www.iea.org/stats/index.asp), subject to https://www.iea.org/t&c/termsandconditions/
Categories, topics:
Energy & Mining, Environment
Last updated:
apr 23, 2017
Indicators value changes by year
Minimum:
64.045
jan 1, 2005
Maximum:
73.663
jan 1, 1991
At the date of observation
Value
Absolute change
Change from previous value
jan 1, 1991
73.663
+73.663
0.0%
jan 1, 1992
72.488
-1.174
-1.59%
jan 1, 1993
70.876
-1.613
-2.22%
jan 1, 1994
68.086
-2.789
-3.94%
jan 1, 1995
67.326
-0.761
-1.12%
jan 1, 1996
66.386
-0.939
-1.4%
jan 1, 1997
65.307
-1.079
-1.63%
jan 1, 1998
64.732
-0.575
-0.88%
jan 1, 1999
64.357
-0.376
-0.58%
jan 1, 2000
64.075
-0.281
-0.44%
jan 1, 2001
64.877
+0.801
1.25%
jan 1, 2002
64.931
+0.055
0.08%
jan 1, 2003
64.684
-0.247
-0.38%
jan 1, 2004
65.69
+1.006
1.56%
jan 1, 2005
64.045
-1.645
-2.5%
jan 1, 2006
64.644
+0.598
0.93%
jan 1, 2007
65.37
+0.726
1.12%
jan 1, 2008
66.788
+1.418
2.17%
jan 1, 2009
68.001
+1.214
1.82%
jan 1, 2010
65.971
-2.03
-2.99%
jan 1, 2011
65.387
-0.584
-0.89%
jan 1, 2012
67.006
+1.619
2.48%
jan 1, 2013
66.924
-0.082
-0.12%
jan 1, 2014
65.545
-1.378
-2.06%
Ranking of countries by current statistics by years


Comments: