29
/
en
AIzaSyAYiBZKx7MnpbEhh9jyipgxe19OcubqV5w
April 1, 2024
44181
Least developed countries: UN classification
LDC
false
2
1
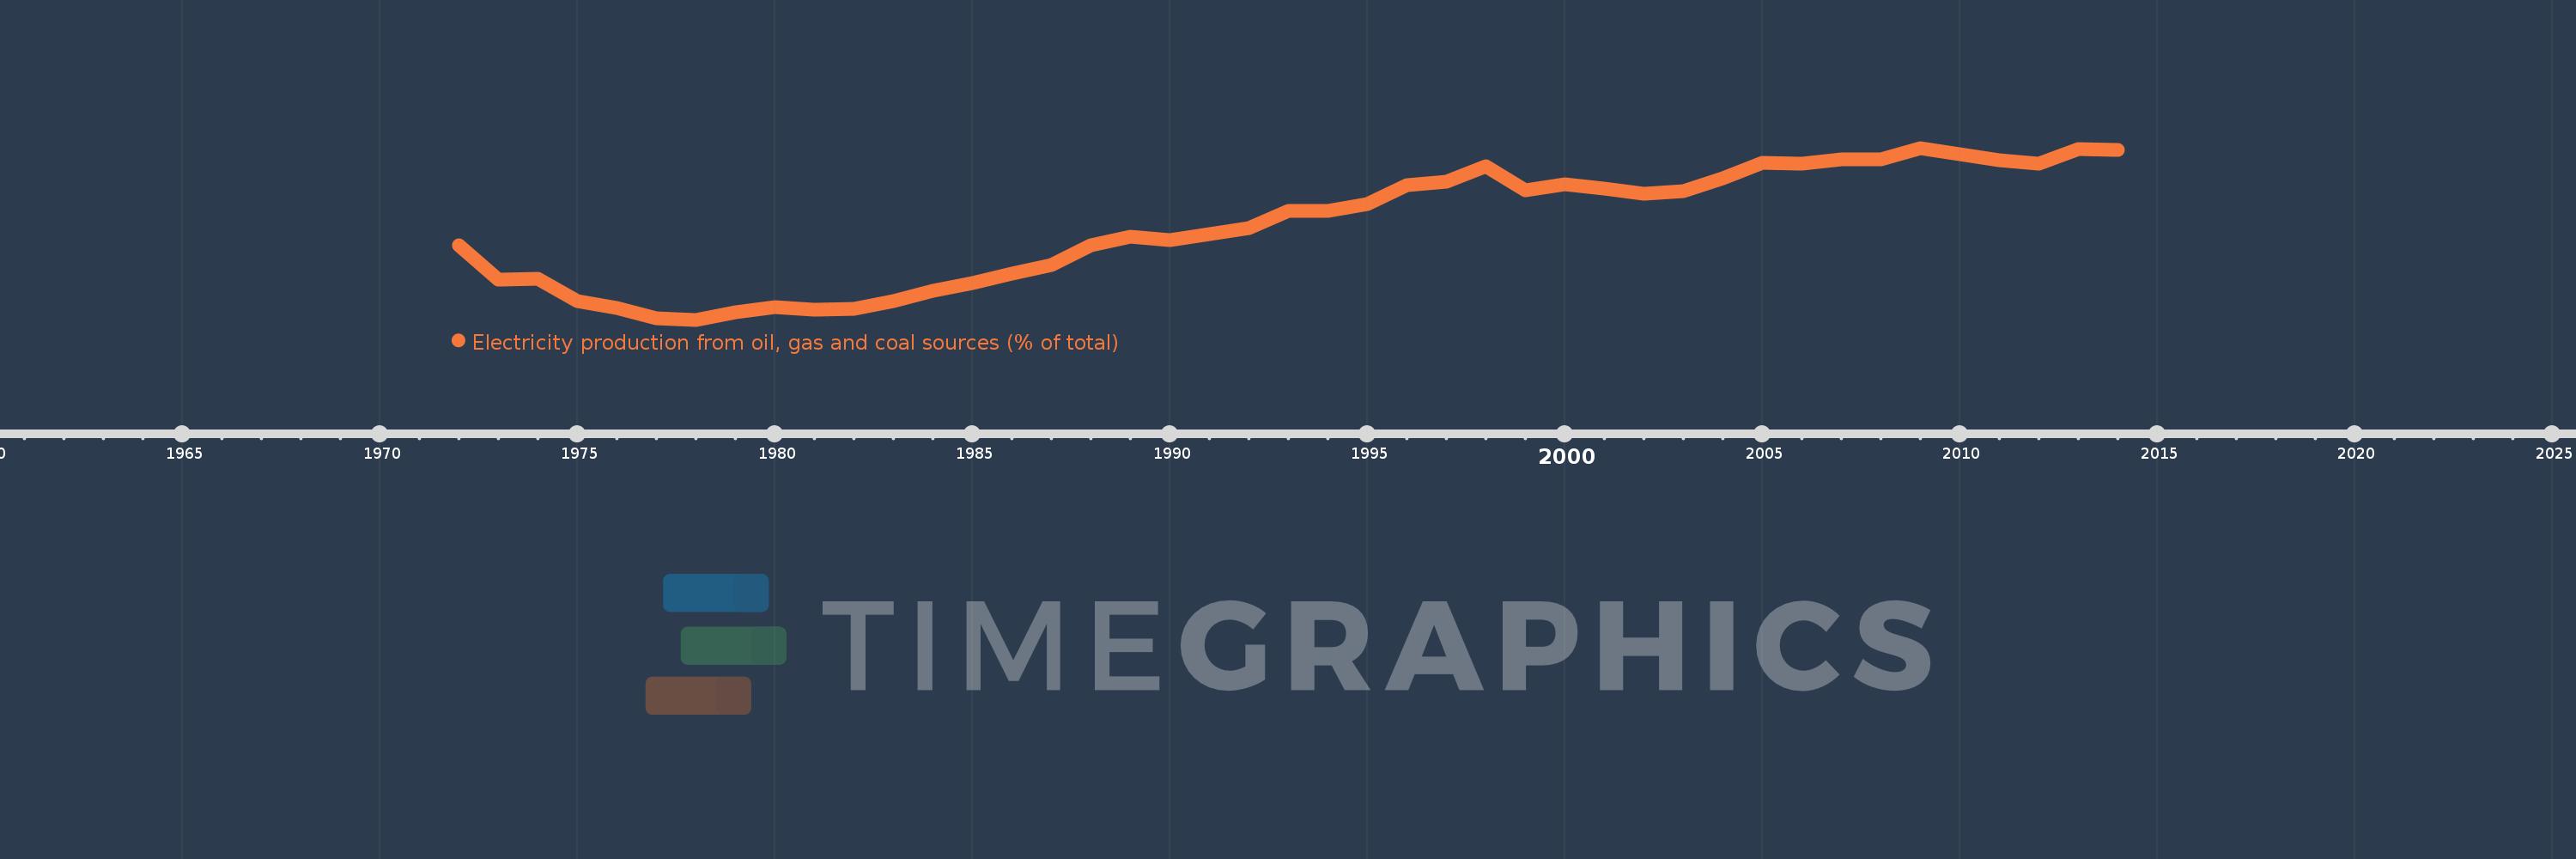
Electricity production from oil, gas and coal sources (% of total)
2014,2013,2012,2011,2010,2009,2008,2007,2006,2005,2004,2003,2002,2001,2000,1999,1998,1997,1996,1995,1994,1993,1992,1991,1990,1989,1988,1987,1986,1985,1984,1983,1982,1981,1980,1979,1978,1977,1976,1975,1974,1973,1972
This statistics in other country:
AlbaniaAlgeriaAngolaArab WorldArgentinaArmeniaAustraliaAustriaAzerbaijanBahrainBangladeshBelarusBelgiumBeninBoliviaBosnia and HerzegovinaBotswanaBrazilBrunei DarussalamBulgariaCambodiaCameroonCanadaCentral Europe and the BalticsChileChinaColombiaCongo, Dem. Rep.Congo, Rep.Costa RicaCote d'IvoireCroatiaCubaCuracaoCyprusCzech RepublicDenmarkDominican RepublicEarly-demographic dividendEast Asia & PacificEast Asia & Pacific (excluding high income)East Asia & Pacific (IDA & IBRD countries)EcuadorEgypt, Arab Rep.El SalvadorEritreaEstoniaEthiopiaEuro areaEurope & Central AsiaEurope & Central Asia (excluding high income)Europe & Central Asia (IDA & IBRD countries)European UnionFinlandFragile and conflict affected situationsFranceGabonGeorgiaGermanyGhanaGibraltarGreeceGuatemalaHaitiHeavily indebted poor countries (HIPC)High incomeHondurasHong Kong SAR, ChinaHungaryIBRD onlyIcelandIDA & IBRD totalIDA blendIDA onlyIDA totalIndiaIndonesiaIran, Islamic Rep.IraqIrelandIsraelItalyJamaicaJapanJordanKazakhstanKenyaKorea, Dem. People’s Rep.Korea, Rep.KosovoKuwaitKyrgyz RepublicLate-demographic dividendLatin America & Caribbean Latin America & Caribbean (excluding high income)Latin America & the Caribbean (IDA & IBRD countries)LatviaLeast developed countries: UN classificationLebanonLibyaLithuaniaLow & middle incomeLower middle incomeLuxembourgMacedonia, FYRMalaysiaMaltaMauritiusMexicoMiddle East & North AfricaMiddle East & North Africa (excluding high income)Middle East & North Africa (IDA & IBRD countries)Middle incomeMoldovaMongoliaMontenegroMoroccoMozambiqueMyanmarNamibiaNepalNetherlandsNew ZealandNicaraguaNigerNigeriaNorth AmericaNorwayOECD membersOmanOther small statesPakistanPanamaParaguayPeruPhilippinesPolandPortugalPost-demographic dividendPre-demographic dividendQatarRomaniaRussian FederationSaudi ArabiaSenegalSerbiaSingaporeSlovak RepublicSloveniaSmall statesSouth AfricaSouth AsiaSouth Asia (IDA & IBRD)South SudanSpainSri LankaSub-Saharan Africa Sub-Saharan Africa (excluding high income)Sub-Saharan Africa (IDA & IBRD countries)SudanSwedenSwitzerlandSyrian Arab RepublicTajikistanTanzaniaThailandTogoTrinidad and TobagoTunisiaTurkeyTurkmenistanUkraineUnited Arab EmiratesUnited KingdomUnited StatesUpper middle incomeUruguayUzbekistanVenezuela, RBVietnamWorldYemen, Rep.ZambiaZimbabwe Timeline:
This timeline shows a graph from 1972 to 2014 of Least developed countries: UN classification. No data until 1971. Number of actual observations by date: 43.
Source name:
World Development Indicators
Source organization:
IEA Statistics © OECD/IEA 2014 (http://www.iea.org/stats/index.asp), subject to https://www.iea.org/t&c/termsandconditions/
Categories, topics:
Energy & Mining, Environment
Last updated:
apr 23, 2017
Indicators value changes by year
Minimum:
15.078
jan 1, 1978
Maximum:
41.047
jan 1, 2009
At the date of observation
Value
Absolute change
Change from previous value
jan 1, 1972
26.311
+26.311
0.0%
jan 1, 1973
21.17
-5.141
-19.54%
jan 1, 1974
21.258
+0.088
0.41%
jan 1, 1975
17.924
-3.333
-15.68%
jan 1, 1976
16.864
-1.06
-5.91%
jan 1, 1977
15.271
-1.594
-9.45%
jan 1, 1978
15.078
-0.193
-1.26%
jan 1, 1979
16.168
+1.09
7.23%
jan 1, 1980
17.049
+0.881
5.45%
jan 1, 1981
16.618
-0.431
-2.53%
jan 1, 1982
16.775
+0.158
0.95%
jan 1, 1983
17.85
+1.075
6.41%
jan 1, 1984
19.394
+1.544
8.65%
jan 1, 1985
20.559
+1.164
6.0%
jan 1, 1986
22.07
+1.511
7.35%
jan 1, 1987
23.295
+1.225
5.55%
jan 1, 1988
26.388
+3.094
13.28%
jan 1, 1989
27.616
+1.227
4.65%
jan 1, 1990
27.081
-0.534
-1.93%
jan 1, 1991
28.008
+0.927
3.42%
jan 1, 1992
28.916
+0.908
3.24%
jan 1, 1993
31.515
+2.599
8.99%
jan 1, 1994
31.515
0.0
0.0%
jan 1, 1995
32.581
+1.066
3.38%
jan 1, 1996
35.486
+2.905
8.92%
jan 1, 1997
35.943
+0.457
1.29%
jan 1, 1998
38.224
+2.281
6.35%
jan 1, 1999
34.679
-3.545
-9.27%
jan 1, 2000
35.535
+0.856
2.47%
jan 1, 2001
34.969
-0.566
-1.59%
jan 1, 2002
34.165
-0.805
-2.3%
jan 1, 2003
34.464
+0.3
0.88%
jan 1, 2004
36.517
+2.052
5.96%
jan 1, 2005
38.864
+2.347
6.43%
jan 1, 2006
38.703
-0.161
-0.41%
jan 1, 2007
39.307
+0.604
1.56%
jan 1, 2008
39.367
+0.06
0.15%
jan 1, 2009
41.047
+1.679
4.27%
jan 1, 2010
40.089
-0.957
-2.33%
jan 1, 2011
39.242
-0.847
-2.11%
jan 1, 2012
38.659
-0.583
-1.49%
jan 1, 2013
40.858
+2.199
5.69%
jan 1, 2014
40.69
-0.168
-0.41%
Ranking of countries by current statistics by years


Comments: