29
/
en
AIzaSyAYiBZKx7MnpbEhh9jyipgxe19OcubqV5w
April 1, 2024
33343
European Union
EUU
false
2
1
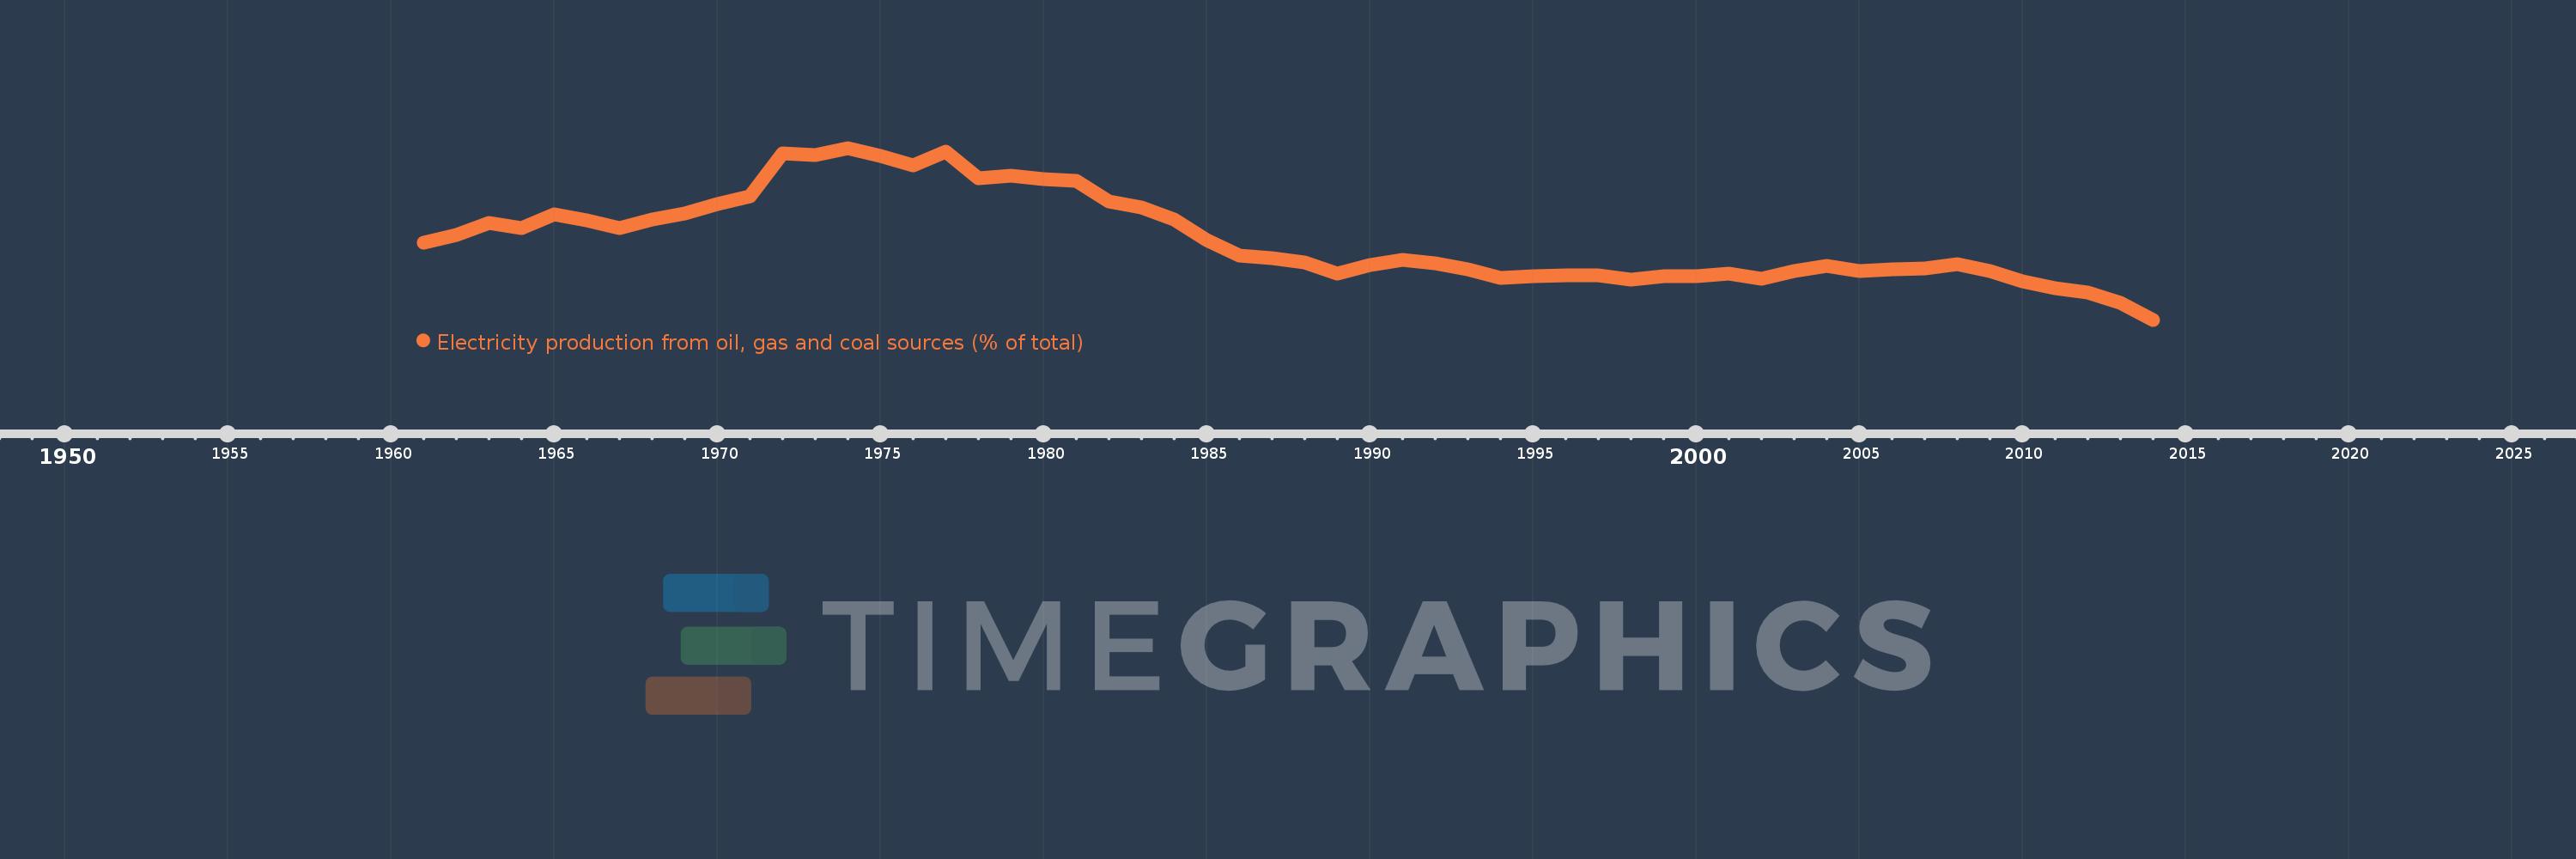
Electricity production from oil, gas and coal sources (% of total)
2014,2013,2012,2011,2010,2009,2008,2007,2006,2005,2004,2003,2002,2001,2000,1999,1998,1997,1996,1995,1994,1993,1992,1991,1990,1989,1988,1987,1986,1985,1984,1983,1982,1981,1980,1979,1978,1977,1976,1975,1974,1973,1972,1971,1970,1969,1968,1967,1966,1965,1964,1963,1962,1961
This statistics in other country:
AlbaniaAlgeriaAngolaArab WorldArgentinaArmeniaAustraliaAustriaAzerbaijanBahrainBangladeshBelarusBelgiumBeninBoliviaBosnia and HerzegovinaBotswanaBrazilBrunei DarussalamBulgariaCambodiaCameroonCanadaCentral Europe and the BalticsChileChinaColombiaCongo, Dem. Rep.Congo, Rep.Costa RicaCote d'IvoireCroatiaCubaCuracaoCyprusCzech RepublicDenmarkDominican RepublicEarly-demographic dividendEast Asia & PacificEast Asia & Pacific (excluding high income)East Asia & Pacific (IDA & IBRD countries)EcuadorEgypt, Arab Rep.El SalvadorEritreaEstoniaEthiopiaEuro areaEurope & Central AsiaEurope & Central Asia (excluding high income)Europe & Central Asia (IDA & IBRD countries)European UnionFinlandFragile and conflict affected situationsFranceGabonGeorgiaGermanyGhanaGibraltarGreeceGuatemalaHaitiHeavily indebted poor countries (HIPC)High incomeHondurasHong Kong SAR, ChinaHungaryIBRD onlyIcelandIDA & IBRD totalIDA blendIDA onlyIDA totalIndiaIndonesiaIran, Islamic Rep.IraqIrelandIsraelItalyJamaicaJapanJordanKazakhstanKenyaKorea, Dem. People’s Rep.Korea, Rep.KosovoKuwaitKyrgyz RepublicLate-demographic dividendLatin America & Caribbean Latin America & Caribbean (excluding high income)Latin America & the Caribbean (IDA & IBRD countries)LatviaLeast developed countries: UN classificationLebanonLibyaLithuaniaLow & middle incomeLower middle incomeLuxembourgMacedonia, FYRMalaysiaMaltaMauritiusMexicoMiddle East & North AfricaMiddle East & North Africa (excluding high income)Middle East & North Africa (IDA & IBRD countries)Middle incomeMoldovaMongoliaMontenegroMoroccoMozambiqueMyanmarNamibiaNepalNetherlandsNew ZealandNicaraguaNigerNigeriaNorth AmericaNorwayOECD membersOmanOther small statesPakistanPanamaParaguayPeruPhilippinesPolandPortugalPost-demographic dividendPre-demographic dividendQatarRomaniaRussian FederationSaudi ArabiaSenegalSerbiaSingaporeSlovak RepublicSloveniaSmall statesSouth AfricaSouth AsiaSouth Asia (IDA & IBRD)South SudanSpainSri LankaSub-Saharan Africa Sub-Saharan Africa (excluding high income)Sub-Saharan Africa (IDA & IBRD countries)SudanSwedenSwitzerlandSyrian Arab RepublicTajikistanTanzaniaThailandTogoTrinidad and TobagoTunisiaTurkeyTurkmenistanUkraineUnited Arab EmiratesUnited KingdomUnited StatesUpper middle incomeUruguayUzbekistanVenezuela, RBVietnamWorldYemen, Rep.ZambiaZimbabwe Timeline:
This timeline shows a graph from 1961 to 2014 of European Union. No data until 1960. Number of actual observations by date: 54.
Source name:
World Development Indicators
Source organization:
IEA Statistics © OECD/IEA 2014 (http://www.iea.org/stats/index.asp), subject to https://www.iea.org/t&c/termsandconditions/
Categories, topics:
Energy & Mining, Environment
Last updated:
apr 23, 2017
Indicators value changes by year
Minimum:
45.081
jan 1, 2014
Maximum:
76.774
jan 1, 1974
At the date of observation
Value
Absolute change
Change from previous value
jan 1, 1961
59.331
+59.331
0.0%
jan 1, 1962
60.76
+1.429
2.41%
jan 1, 1963
62.917
+2.157
3.55%
jan 1, 1964
61.986
-0.932
-1.48%
jan 1, 1965
64.51
+2.524
4.07%
jan 1, 1966
63.394
-1.116
-1.73%
jan 1, 1967
62.038
-1.356
-2.14%
jan 1, 1968
63.553
+1.515
2.44%
jan 1, 1969
64.631
+1.078
1.7%
jan 1, 1970
66.36
+1.729
2.68%
jan 1, 1971
67.866
+1.506
2.27%
jan 1, 1972
75.853
+7.987
11.77%
jan 1, 1973
75.515
-0.338
-0.45%
jan 1, 1974
76.774
+1.259
1.67%
jan 1, 1975
75.305
-1.469
-1.91%
jan 1, 1976
73.635
-1.671
-2.22%
jan 1, 1977
76.115
+2.481
3.37%
jan 1, 1978
71.218
-4.897
-6.43%
jan 1, 1979
71.722
+0.504
0.71%
jan 1, 1980
71.086
-0.636
-0.89%
jan 1, 1981
70.676
-0.41
-0.58%
jan 1, 1982
66.907
-3.769
-5.33%
jan 1, 1983
65.832
-1.075
-1.61%
jan 1, 1984
63.517
-2.315
-3.52%
jan 1, 1985
59.801
-3.716
-5.85%
jan 1, 1986
56.985
-2.816
-4.71%
jan 1, 1987
56.372
-0.613
-1.08%
jan 1, 1988
55.609
-0.763
-1.35%
jan 1, 1989
53.595
-2.015
-3.62%
jan 1, 1990
55.234
+1.639
3.06%
jan 1, 1991
56.179
+0.945
1.71%
jan 1, 1992
55.492
-0.687
-1.22%
jan 1, 1993
54.367
-1.125
-2.03%
jan 1, 1994
52.817
-1.55
-2.85%
jan 1, 1995
53.101
+0.284
0.54%
jan 1, 1996
53.351
+0.25
0.47%
jan 1, 1997
53.218
-0.133
-0.25%
jan 1, 1998
52.523
-0.695
-1.31%
jan 1, 1999
53.116
+0.592
1.13%
jan 1, 2000
53.169
+0.054
0.1%
jan 1, 2001
53.618
+0.449
0.84%
jan 1, 2002
52.619
-0.999
-1.86%
jan 1, 2003
54.024
+1.405
2.67%
jan 1, 2004
55.053
+1.029
1.9%
jan 1, 2005
54.087
-0.966
-1.75%
jan 1, 2006
54.428
+0.341
0.63%
jan 1, 2007
54.571
+0.143
0.26%
jan 1, 2008
55.405
+0.834
1.53%
jan 1, 2009
54.119
-1.286
-2.32%
jan 1, 2010
52.14
-1.98
-3.66%
jan 1, 2011
50.83
-1.31
-2.51%
jan 1, 2012
50.18
-0.65
-1.28%
jan 1, 2013
48.202
-1.978
-3.94%
jan 1, 2014
45.081
-3.12
-6.47%
Ranking of countries by current statistics by years


Comments: