29
/
en
AIzaSyAYiBZKx7MnpbEhh9jyipgxe19OcubqV5w
April 1, 2024
48047
Middle East & North Africa
MEA
false
2
1
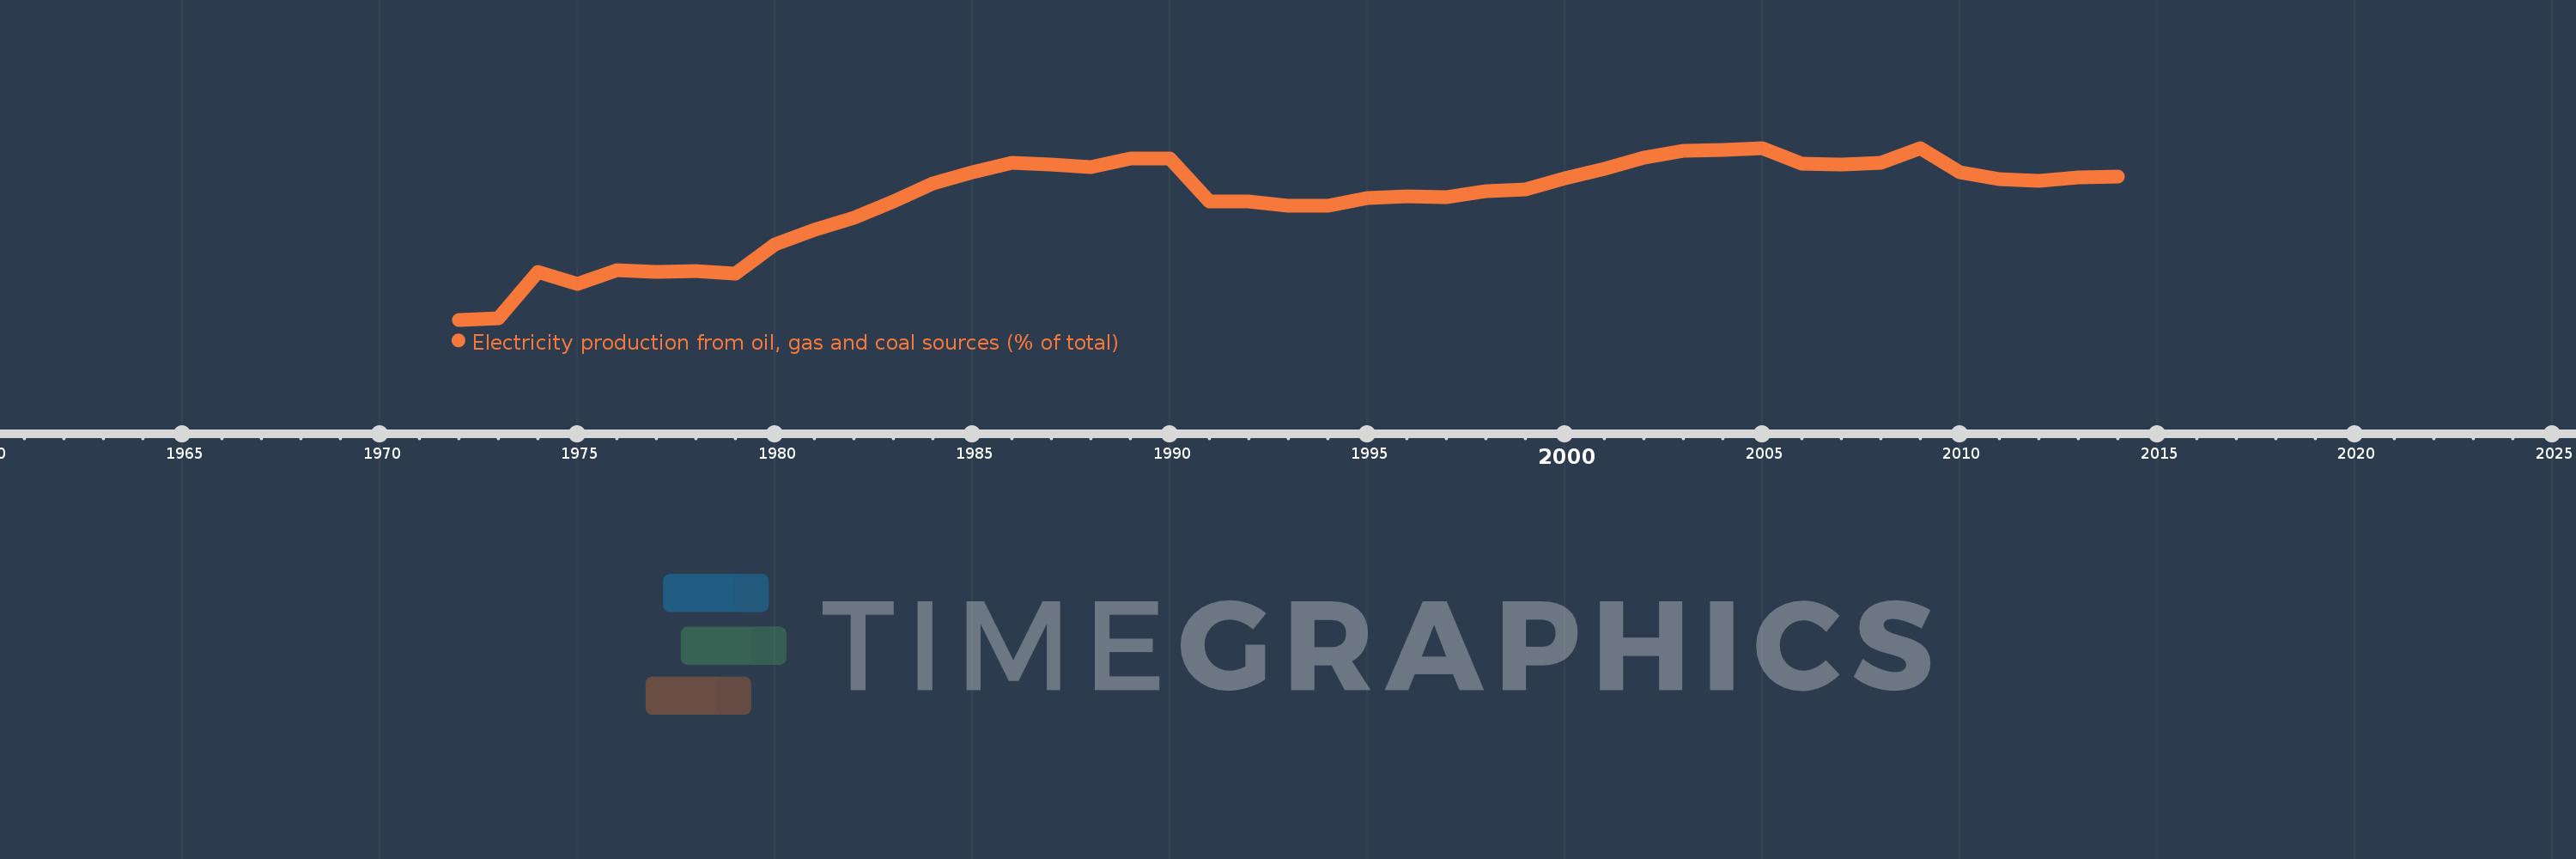
Electricity production from oil, gas and coal sources (% of total)
2014,2013,2012,2011,2010,2009,2008,2007,2006,2005,2004,2003,2002,2001,2000,1999,1998,1997,1996,1995,1994,1993,1992,1991,1990,1989,1988,1987,1986,1985,1984,1983,1982,1981,1980,1979,1978,1977,1976,1975,1974,1973,1972
This statistics in other country:
AlbaniaAlgeriaAngolaArab WorldArgentinaArmeniaAustraliaAustriaAzerbaijanBahrainBangladeshBelarusBelgiumBeninBoliviaBosnia and HerzegovinaBotswanaBrazilBrunei DarussalamBulgariaCambodiaCameroonCanadaCentral Europe and the BalticsChileChinaColombiaCongo, Dem. Rep.Congo, Rep.Costa RicaCote d'IvoireCroatiaCubaCuracaoCyprusCzech RepublicDenmarkDominican RepublicEarly-demographic dividendEast Asia & PacificEast Asia & Pacific (excluding high income)East Asia & Pacific (IDA & IBRD countries)EcuadorEgypt, Arab Rep.El SalvadorEritreaEstoniaEthiopiaEuro areaEurope & Central AsiaEurope & Central Asia (excluding high income)Europe & Central Asia (IDA & IBRD countries)European UnionFinlandFragile and conflict affected situationsFranceGabonGeorgiaGermanyGhanaGibraltarGreeceGuatemalaHaitiHeavily indebted poor countries (HIPC)High incomeHondurasHong Kong SAR, ChinaHungaryIBRD onlyIcelandIDA & IBRD totalIDA blendIDA onlyIDA totalIndiaIndonesiaIran, Islamic Rep.IraqIrelandIsraelItalyJamaicaJapanJordanKazakhstanKenyaKorea, Dem. People’s Rep.Korea, Rep.KosovoKuwaitKyrgyz RepublicLate-demographic dividendLatin America & Caribbean Latin America & Caribbean (excluding high income)Latin America & the Caribbean (IDA & IBRD countries)LatviaLeast developed countries: UN classificationLebanonLibyaLithuaniaLow & middle incomeLower middle incomeLuxembourgMacedonia, FYRMalaysiaMaltaMauritiusMexicoMiddle East & North AfricaMiddle East & North Africa (excluding high income)Middle East & North Africa (IDA & IBRD countries)Middle incomeMoldovaMongoliaMontenegroMoroccoMozambiqueMyanmarNamibiaNepalNetherlandsNew ZealandNicaraguaNigerNigeriaNorth AmericaNorwayOECD membersOmanOther small statesPakistanPanamaParaguayPeruPhilippinesPolandPortugalPost-demographic dividendPre-demographic dividendQatarRomaniaRussian FederationSaudi ArabiaSenegalSerbiaSingaporeSlovak RepublicSloveniaSmall statesSouth AfricaSouth AsiaSouth Asia (IDA & IBRD)South SudanSpainSri LankaSub-Saharan Africa Sub-Saharan Africa (excluding high income)Sub-Saharan Africa (IDA & IBRD countries)SudanSwedenSwitzerlandSyrian Arab RepublicTajikistanTanzaniaThailandTogoTrinidad and TobagoTunisiaTurkeyTurkmenistanUkraineUnited Arab EmiratesUnited KingdomUnited StatesUpper middle incomeUruguayUzbekistanVenezuela, RBVietnamWorldYemen, Rep.ZambiaZimbabwe Timeline:
This timeline shows a graph from 1972 to 2014 of Middle East & North Africa. No data until 1971. Number of actual observations by date: 43.
Source name:
World Development Indicators
Source organization:
IEA Statistics © OECD/IEA 2014 (http://www.iea.org/stats/index.asp), subject to https://www.iea.org/t&c/termsandconditions/
Categories, topics:
Energy & Mining, Environment
Last updated:
apr 23, 2017
Indicators value changes by year
Minimum:
73.991
jan 1, 1972
Maximum:
92.903
jan 1, 2005
At the date of observation
Value
Absolute change
Change from previous value
jan 1, 1972
73.991
+73.991
0.0%
jan 1, 1973
74.167
+0.176
0.24%
jan 1, 1974
79.264
+5.097
6.87%
jan 1, 1975
77.934
-1.329
-1.68%
jan 1, 1976
79.409
+1.475
1.89%
jan 1, 1977
79.253
-0.156
-0.2%
jan 1, 1978
79.348
+0.096
0.12%
jan 1, 1979
79.054
-0.294
-0.37%
jan 1, 1980
82.264
+3.21
4.06%
jan 1, 1981
83.861
+1.597
1.94%
jan 1, 1982
85.23
+1.369
1.63%
jan 1, 1983
87.004
+1.774
2.08%
jan 1, 1984
89.035
+2.031
2.33%
jan 1, 1985
90.22
+1.186
1.33%
jan 1, 1986
91.294
+1.074
1.19%
jan 1, 1987
91.105
-0.189
-0.21%
jan 1, 1988
90.819
-0.286
-0.31%
jan 1, 1989
91.74
+0.921
1.01%
jan 1, 1990
91.737
-0.003
0.0%
jan 1, 1991
87.017
-4.72
-5.15%
jan 1, 1992
86.98
-0.038
-0.04%
jan 1, 1993
86.508
-0.471
-0.54%
jan 1, 1994
86.508
0.0
0.0%
jan 1, 1995
87.349
+0.841
0.97%
jan 1, 1996
87.59
+0.241
0.28%
jan 1, 1997
87.517
-0.073
-0.08%
jan 1, 1998
88.158
+0.641
0.73%
jan 1, 1999
88.305
+0.147
0.17%
jan 1, 2000
89.584
+1.279
1.45%
jan 1, 2001
90.564
+0.98
1.09%
jan 1, 2002
91.792
+1.228
1.36%
jan 1, 2003
92.58
+0.788
0.86%
jan 1, 2004
92.65
+0.07
0.08%
jan 1, 2005
92.903
+0.252
0.27%
jan 1, 2006
91.162
-1.741
-1.87%
jan 1, 2007
91.096
-0.066
-0.07%
jan 1, 2008
91.276
+0.18
0.2%
jan 1, 2009
92.874
+1.598
1.75%
jan 1, 2010
90.268
-2.606
-2.81%
jan 1, 2011
89.432
-0.836
-0.93%
jan 1, 2012
89.269
-0.163
-0.18%
jan 1, 2013
89.648
+0.379
0.42%
jan 1, 2014
89.734
+0.086
0.1%
Ranking of countries by current statistics by years


Comments: