29
/
en
AIzaSyAYiBZKx7MnpbEhh9jyipgxe19OcubqV5w
April 1, 2024
124680
Egypt, Arab Rep.
EGY
true
2
1
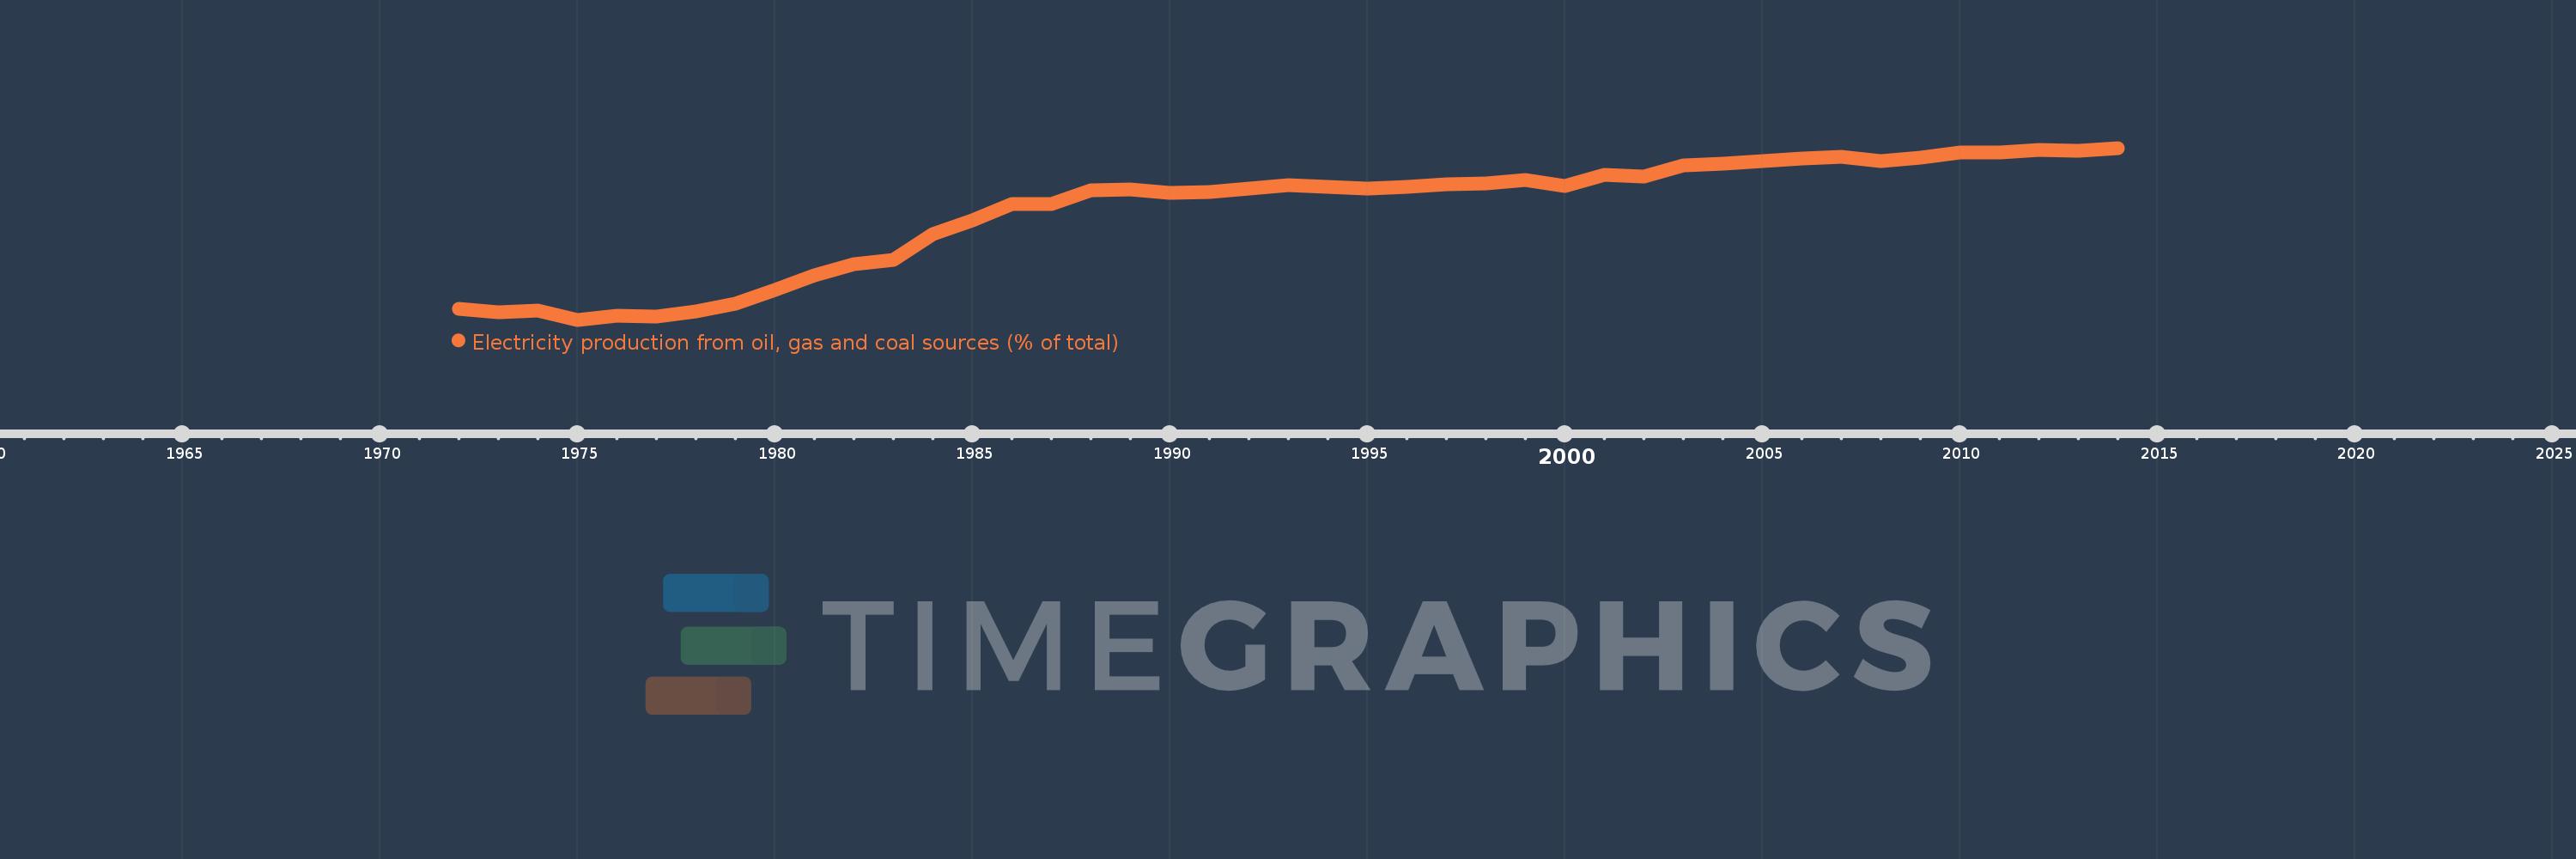
Electricity production from oil, gas and coal sources (% of total)
2014,2013,2012,2011,2010,2009,2008,2007,2006,2005,2004,2003,2002,2001,2000,1999,1998,1997,1996,1995,1994,1993,1992,1991,1990,1989,1988,1987,1986,1985,1984,1983,1982,1981,1980,1979,1978,1977,1976,1975,1974,1973,1972
This statistics in other country:
AlbaniaAlgeriaAngolaArab WorldArgentinaArmeniaAustraliaAustriaAzerbaijanBahrainBangladeshBelarusBelgiumBeninBoliviaBosnia and HerzegovinaBotswanaBrazilBrunei DarussalamBulgariaCambodiaCameroonCanadaCentral Europe and the BalticsChileChinaColombiaCongo, Dem. Rep.Congo, Rep.Costa RicaCote d'IvoireCroatiaCubaCuracaoCyprusCzech RepublicDenmarkDominican RepublicEarly-demographic dividendEast Asia & PacificEast Asia & Pacific (excluding high income)East Asia & Pacific (IDA & IBRD countries)EcuadorEgypt, Arab Rep.El SalvadorEritreaEstoniaEthiopiaEuro areaEurope & Central AsiaEurope & Central Asia (excluding high income)Europe & Central Asia (IDA & IBRD countries)European UnionFinlandFragile and conflict affected situationsFranceGabonGeorgiaGermanyGhanaGibraltarGreeceGuatemalaHaitiHeavily indebted poor countries (HIPC)High incomeHondurasHong Kong SAR, ChinaHungaryIBRD onlyIcelandIDA & IBRD totalIDA blendIDA onlyIDA totalIndiaIndonesiaIran, Islamic Rep.IraqIrelandIsraelItalyJamaicaJapanJordanKazakhstanKenyaKorea, Dem. People’s Rep.Korea, Rep.KosovoKuwaitKyrgyz RepublicLate-demographic dividendLatin America & Caribbean Latin America & Caribbean (excluding high income)Latin America & the Caribbean (IDA & IBRD countries)LatviaLeast developed countries: UN classificationLebanonLibyaLithuaniaLow & middle incomeLower middle incomeLuxembourgMacedonia, FYRMalaysiaMaltaMauritiusMexicoMiddle East & North AfricaMiddle East & North Africa (excluding high income)Middle East & North Africa (IDA & IBRD countries)Middle incomeMoldovaMongoliaMontenegroMoroccoMozambiqueMyanmarNamibiaNepalNetherlandsNew ZealandNicaraguaNigerNigeriaNorth AmericaNorwayOECD membersOmanOther small statesPakistanPanamaParaguayPeruPhilippinesPolandPortugalPost-demographic dividendPre-demographic dividendQatarRomaniaRussian FederationSaudi ArabiaSenegalSerbiaSingaporeSlovak RepublicSloveniaSmall statesSouth AfricaSouth AsiaSouth Asia (IDA & IBRD)South SudanSpainSri LankaSub-Saharan Africa Sub-Saharan Africa (excluding high income)Sub-Saharan Africa (IDA & IBRD countries)SudanSwedenSwitzerlandSyrian Arab RepublicTajikistanTanzaniaThailandTogoTrinidad and TobagoTunisiaTurkeyTurkmenistanUkraineUnited Arab EmiratesUnited KingdomUnited StatesUpper middle incomeUruguayUzbekistanVenezuela, RBVietnamWorldYemen, Rep.ZambiaZimbabwe Timeline:
This timeline shows a graph from 1972 to 2014 of Egypt, Arab Rep.. No data until 1971. Number of actual observations by date: 43.
Source name:
World Development Indicators
Source organization:
IEA Statistics © OECD/IEA 2014 (http://www.iea.org/stats/index.asp), subject to https://www.iea.org/t&c/termsandconditions/
Categories, topics:
Energy & Mining, Environment
Last updated:
apr 23, 2017
Indicators value changes by year
Minimum:
33.181
jan 1, 1975
Maximum:
91.379
jan 1, 2014
At the date of observation
Value
Absolute change
Change from previous value
jan 1, 1972
36.972
+36.972
0.0%
jan 1, 1973
35.857
-1.114
-3.01%
jan 1, 1974
36.393
+0.536
1.49%
jan 1, 1975
33.181
-3.212
-8.83%
jan 1, 1976
34.561
+1.38
4.16%
jan 1, 1977
34.38
-0.18
-0.52%
jan 1, 1978
36.053
+1.673
4.87%
jan 1, 1979
38.482
+2.429
6.74%
jan 1, 1980
43.224
+4.742
12.32%
jan 1, 1981
48.25
+5.026
11.63%
jan 1, 1982
52.065
+3.815
7.91%
jan 1, 1983
53.606
+1.541
2.96%
jan 1, 1984
62.066
+8.46
15.78%
jan 1, 1985
66.839
+4.773
7.69%
jan 1, 1986
72.462
+5.623
8.41%
jan 1, 1987
72.266
-0.196
-0.27%
jan 1, 1988
77.122
+4.857
6.72%
jan 1, 1989
77.261
+0.139
0.18%
jan 1, 1990
76.052
-1.209
-1.56%
jan 1, 1991
76.496
+0.443
0.58%
jan 1, 1992
77.65
+1.155
1.51%
jan 1, 1993
78.764
+1.114
1.43%
jan 1, 1994
78.063
-0.701
-0.89%
jan 1, 1995
77.748
-0.315
-0.4%
jan 1, 1996
78.052
+0.304
0.39%
jan 1, 1997
79.044
+0.992
1.27%
jan 1, 1998
79.484
+0.44
0.56%
jan 1, 1999
80.59
+1.105
1.39%
jan 1, 2000
78.563
-2.026
-2.51%
jan 1, 2001
82.297
+3.733
4.75%
jan 1, 2002
81.567
-0.729
-0.89%
jan 1, 2003
85.354
+3.786
4.64%
jan 1, 2004
85.936
+0.582
0.68%
jan 1, 2005
87.002
+1.066
1.24%
jan 1, 2006
87.859
+0.857
0.99%
jan 1, 2007
88.267
+0.408
0.46%
jan 1, 2008
86.941
-1.326
-1.5%
jan 1, 2009
88.099
+1.158
1.33%
jan 1, 2010
89.931
+1.832
2.08%
jan 1, 2011
89.952
+0.021
0.02%
jan 1, 2012
90.673
+0.721
0.8%
jan 1, 2013
90.52
-0.153
-0.17%
jan 1, 2014
91.379
+0.858
0.95%
Ranking of countries by current statistics by years


Comments: