29
/
en
AIzaSyAYiBZKx7MnpbEhh9jyipgxe19OcubqV5w
April 1, 2024
67649
Angola
AGO
true
2
1
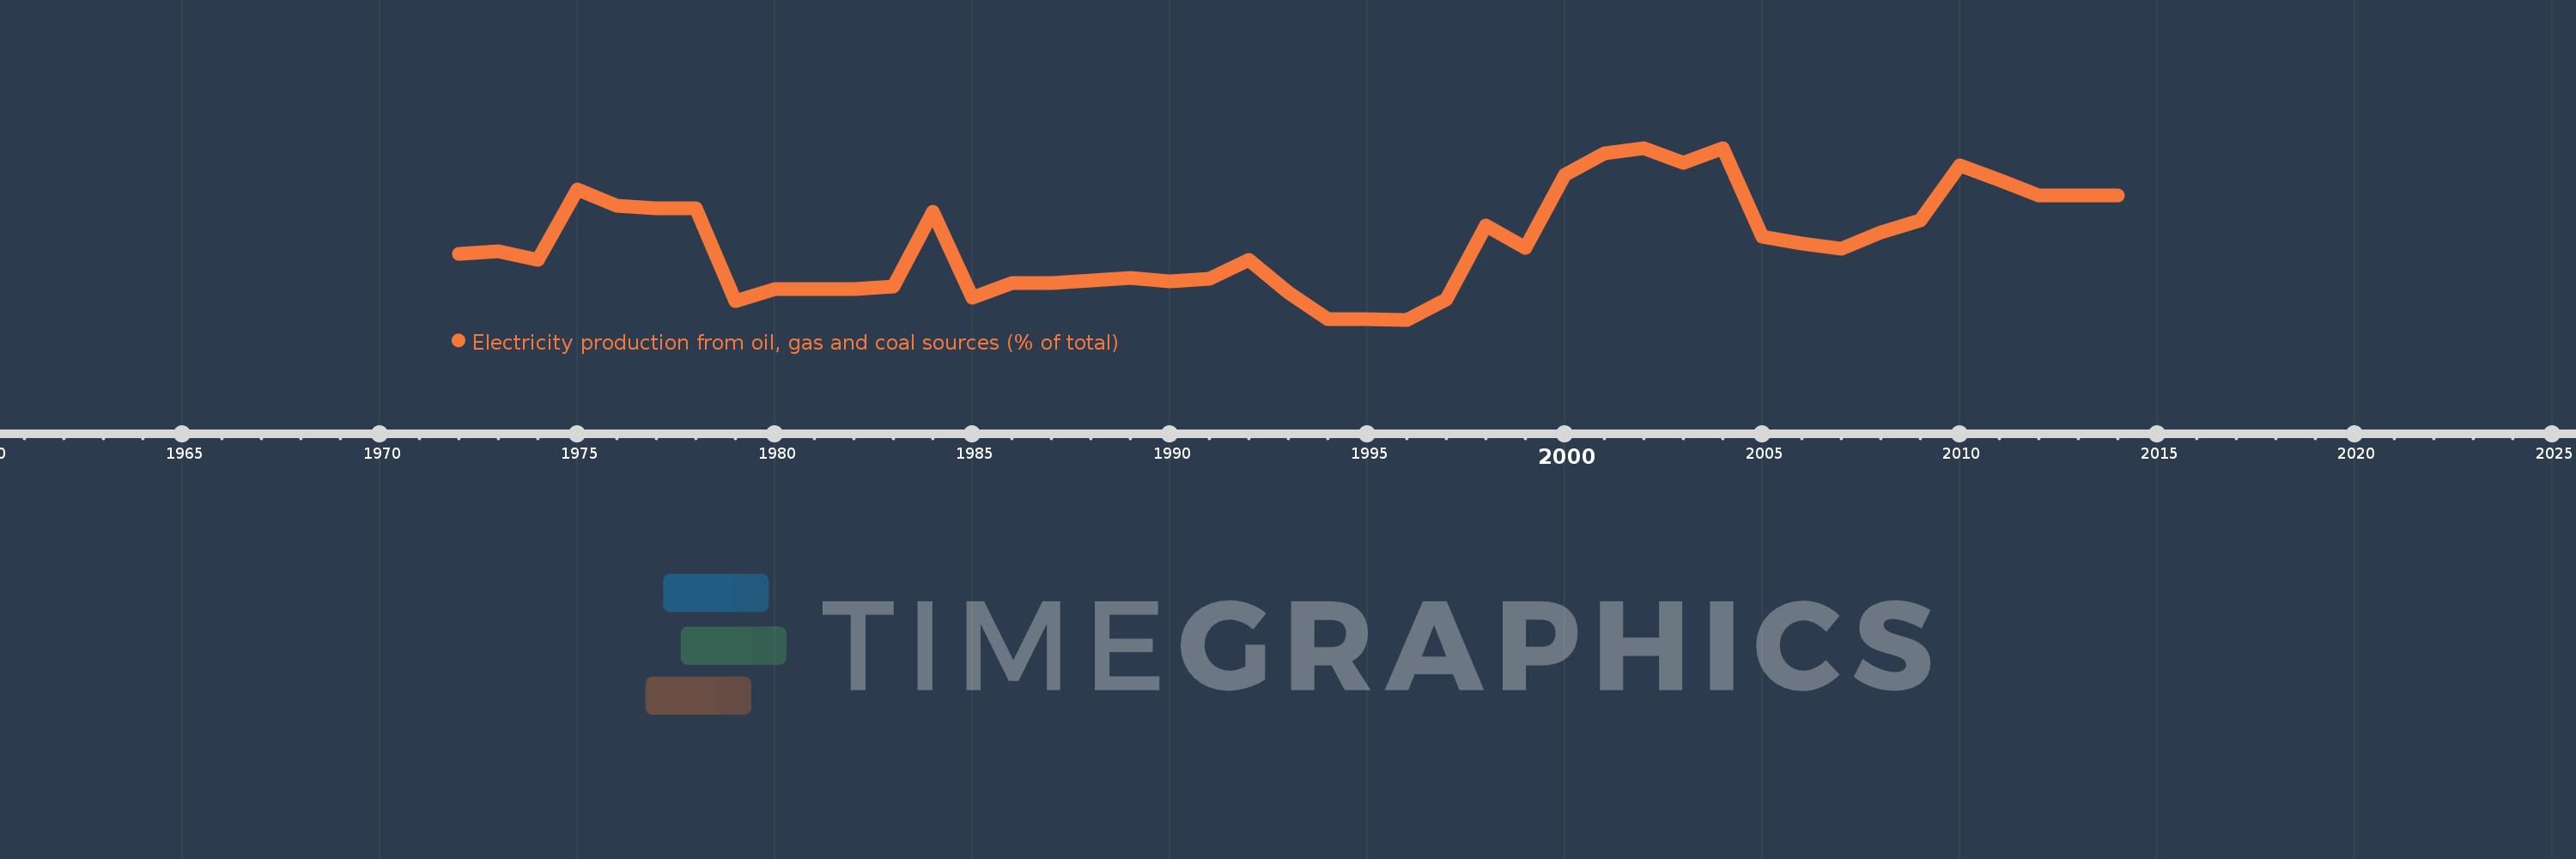
Electricity production from oil, gas and coal sources (% of total)
2014,2013,2012,2011,2010,2009,2008,2007,2006,2005,2004,2003,2002,2001,2000,1999,1998,1997,1996,1995,1994,1993,1992,1991,1990,1989,1988,1987,1986,1985,1984,1983,1982,1981,1980,1979,1978,1977,1976,1975,1974,1973,1972
This statistics in other country:
AlbaniaAlgeriaAngolaArab WorldArgentinaArmeniaAustraliaAustriaAzerbaijanBahrainBangladeshBelarusBelgiumBeninBoliviaBosnia and HerzegovinaBotswanaBrazilBrunei DarussalamBulgariaCambodiaCameroonCanadaCentral Europe and the BalticsChileChinaColombiaCongo, Dem. Rep.Congo, Rep.Costa RicaCote d'IvoireCroatiaCubaCuracaoCyprusCzech RepublicDenmarkDominican RepublicEarly-demographic dividendEast Asia & PacificEast Asia & Pacific (excluding high income)East Asia & Pacific (IDA & IBRD countries)EcuadorEgypt, Arab Rep.El SalvadorEritreaEstoniaEthiopiaEuro areaEurope & Central AsiaEurope & Central Asia (excluding high income)Europe & Central Asia (IDA & IBRD countries)European UnionFinlandFragile and conflict affected situationsFranceGabonGeorgiaGermanyGhanaGibraltarGreeceGuatemalaHaitiHeavily indebted poor countries (HIPC)High incomeHondurasHong Kong SAR, ChinaHungaryIBRD onlyIcelandIDA & IBRD totalIDA blendIDA onlyIDA totalIndiaIndonesiaIran, Islamic Rep.IraqIrelandIsraelItalyJamaicaJapanJordanKazakhstanKenyaKorea, Dem. People’s Rep.Korea, Rep.KosovoKuwaitKyrgyz RepublicLate-demographic dividendLatin America & Caribbean Latin America & Caribbean (excluding high income)Latin America & the Caribbean (IDA & IBRD countries)LatviaLeast developed countries: UN classificationLebanonLibyaLithuaniaLow & middle incomeLower middle incomeLuxembourgMacedonia, FYRMalaysiaMaltaMauritiusMexicoMiddle East & North AfricaMiddle East & North Africa (excluding high income)Middle East & North Africa (IDA & IBRD countries)Middle incomeMoldovaMongoliaMontenegroMoroccoMozambiqueMyanmarNamibiaNepalNetherlandsNew ZealandNicaraguaNigerNigeriaNorth AmericaNorwayOECD membersOmanOther small statesPakistanPanamaParaguayPeruPhilippinesPolandPortugalPost-demographic dividendPre-demographic dividendQatarRomaniaRussian FederationSaudi ArabiaSenegalSerbiaSingaporeSlovak RepublicSloveniaSmall statesSouth AfricaSouth AsiaSouth Asia (IDA & IBRD)South SudanSpainSri LankaSub-Saharan Africa Sub-Saharan Africa (excluding high income)Sub-Saharan Africa (IDA & IBRD countries)SudanSwedenSwitzerlandSyrian Arab RepublicTajikistanTanzaniaThailandTogoTrinidad and TobagoTunisiaTurkeyTurkmenistanUkraineUnited Arab EmiratesUnited KingdomUnited StatesUpper middle incomeUruguayUzbekistanVenezuela, RBVietnamWorldYemen, Rep.ZambiaZimbabwe Timeline:
This timeline shows a graph from 1972 to 2014 of Angola. No data until 1971. Number of actual observations by date: 43.
Source name:
World Development Indicators
Source organization:
IEA Statistics © OECD/IEA 2014 (http://www.iea.org/stats/index.asp), subject to https://www.iea.org/t&c/termsandconditions/
Categories, topics:
Energy & Mining, Environment
Last updated:
apr 23, 2017
Indicators value changes by year
Maximum:
37.912
jan 1, 2002
At the date of observation
Value
Absolute change
Change from previous value
jan 1, 1972
18.464
+18.464
0.0%
jan 1, 1973
18.854
+0.391
2.12%
jan 1, 1974
17.276
-1.578
-8.37%
jan 1, 1975
30.187
+12.911
74.73%
jan 1, 1976
27.203
-2.984
-9.89%
jan 1, 1977
26.838
-0.365
-1.34%
jan 1, 1978
26.838
0.0
0.0%
jan 1, 1979
9.744
-17.094
-63.69%
jan 1, 1980
11.905
+2.161
22.18%
jan 1, 1981
11.852
-0.053
-0.44%
jan 1, 1982
11.852
0.0
0.0%
jan 1, 1983
12.361
+0.509
4.3%
jan 1, 1984
26.181
+13.82
111.8%
jan 1, 1985
10.299
-15.883
-60.66%
jan 1, 1986
13.027
+2.729
26.5%
jan 1, 1987
13.027
0.0
0.0%
jan 1, 1988
13.457
+0.429
3.3%
jan 1, 1989
13.988
+0.531
3.95%
jan 1, 1990
13.309
-0.679
-4.85%
jan 1, 1991
13.793
+0.484
3.64%
jan 1, 1992
17.345
+3.552
25.75%
jan 1, 1993
11.299
-6.046
-34.86%
jan 1, 1994
6.316
-4.983
-44.1%
jan 1, 1995
6.283
-0.033
-0.52%
jan 1, 1996
6.25
-0.033
-0.52%
jan 1, 1997
10.019
+3.769
60.31%
jan 1, 1998
23.647
+13.628
136.02%
jan 1, 1999
19.575
-4.072
-17.22%
jan 1, 2000
33.034
+13.459
68.75%
jan 1, 2001
36.886
+3.852
11.66%
jan 1, 2002
37.912
+1.026
2.78%
jan 1, 2003
35.241
-2.671
-7.05%
jan 1, 2004
37.794
+2.554
7.25%
jan 1, 2005
21.595
-16.2
-42.86%
jan 1, 2006
20.352
-1.243
-5.76%
jan 1, 2007
19.389
-0.963
-4.73%
jan 1, 2008
22.381
+2.992
15.43%
jan 1, 2009
24.591
+2.21
9.87%
jan 1, 2010
34.657
+10.066
40.93%
jan 1, 2011
32.043
-2.614
-7.54%
jan 1, 2012
29.092
-2.95
-9.21%
jan 1, 2013
29.093
+0.001
0.0%
jan 1, 2014
29.091
-0.002
-0.01%
Ranking of countries by current statistics by years


Comments: